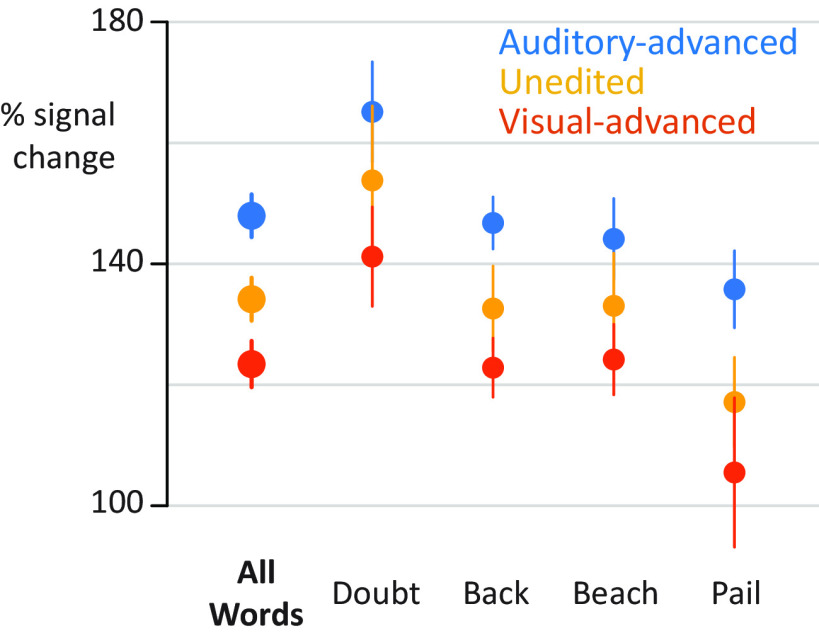
Figure 4.
Responses to individual stimulus exemplars. y axis indicates percent increase in BHA relative to baseline. Points are colored by asynchrony. Error bars indicate within-subject SEM.(see Extended Data Fig. 1-1). For the additive model, auditory (green) and visual (purple) regressors were fit to auditory-advanced words (left column) and visual-advanced words (right column). Unisensory responses were modeled using 99 regressors, starting 10 ms after auditory onset, spaced at 10 ms intervals. Each regressor consisted of a single-tent or stick function (vertical colored line) that was 1 at the appropriate poststimulus onset time and 0 everywhere else (as shown in Fig. 1C). For efficiency, all 99 regressors are shown collapsed onto a single time axis. The auditory regressors for the four different words (“back,” “beach,” “pail,” and “doubt”) were aligned to auditory speech onset (dashed gray line). The visual regressors for the four different words were adjusted to reflect the actual onset time of visual speech for each word.

