Figure 2.
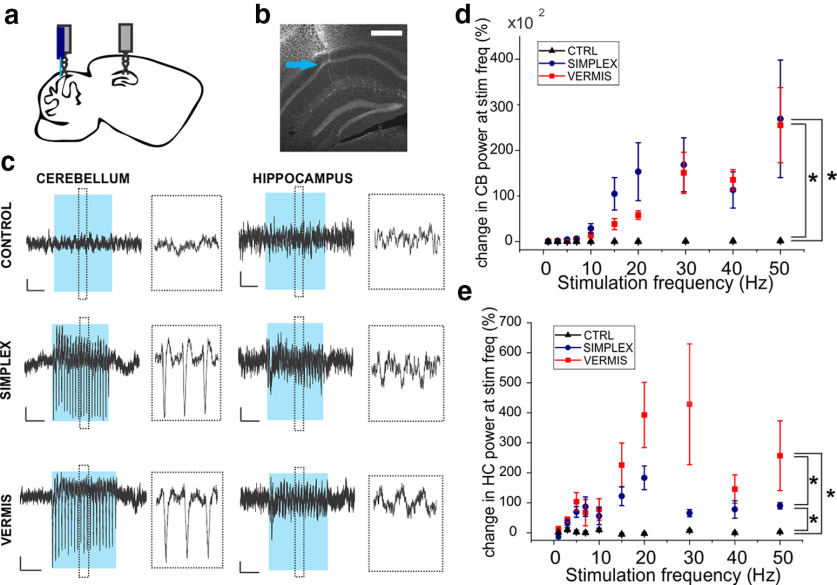
Cerebellar stimulation evokes hippocampal LFP responses. a, Schematic illustration of locations of hippocampal electrode (dorsal hippocampus) and cerebellar optrode (vermis or simplex). b, Example image showing hippocampal electrode tract (blue arrow). Scale bar, 0.5 mm. c, Example traces of averaged LFP recordings from 7 Hz stimulation (10 ms pulse width). Left, Cerebellar electrode. Right, Hippocampal electrode. Blue bar represents light delivery period. Dashed lines indicate the ∼500 ms of data expanded in inset. Calibration: 1s, 5 µV. d, Percent change in power at the stimulation frequency in the cerebellar LFP. *p < 0.001 (mixed-effect ANOVA). e, Percent change in power at the stimulation frequency in the hippocampal recording. *p < 0.01 (mixed-effect ANOVA). Black represents opsin-negative control animals. Blue represents opsin-expressing animals with light delivered to the simplex. Red represents opsin-expressing animals with light delivered to the vermis. Cerebellar stimulation, especially the vermis, caused an increase in hippocampal LFP power. Spectrograms of averaged hippocampal and cerebellar responses are available in Extended Data Figs. 2-1, 2-2, 2-3, 2-4, and 2-5.

