Figure 3.
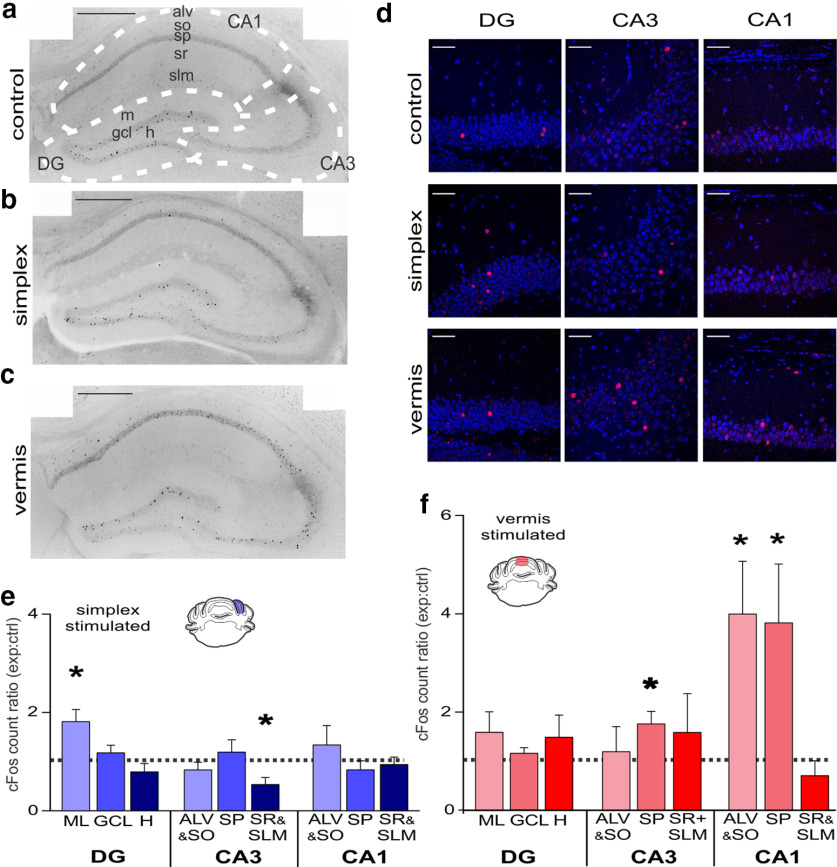
Selective changes to hippocampal cFos expression following cerebellar stimulation. a, Coronal image of hippocampus from a control animal following cerebellar light delivery, processed for cFos immunohistochemistry. Dotted lines and labels indicate hippocampal subregions used for analysis. Scale bar, 0.5 mm. b, Same as in a, from a simplex-targeted opsin-expressing animal. c, Same as in a, from a vermis-targeted opsin-expressing animal. d, Fluorescent images showing cFos expression (red) in different aspects of the hippocampus, following light. Blue represents DAPI. Scale bar, 50 µm. e, cFos expression in simplex-targeted mice normalized to paired opsin-negative controls. *p < 0.05 (Signed-Rank test). f, Same as in e, but for vermis-targeted mice. *p < 0.05 (Signed-Rank test). Vermis-targeted animals displayed an especially strong increase in cFos in both CA1 pyramidale and alveus/oriens. ml, Molecular layer; gcl, granule cell layer; h, hilus; alv, alveus; so, stratum oriens; sp, stratum pyramidale; sr, stratum radiatum; slm, stratum lacunosum moleculare; DG, dentate gyrus; CA, cornu ammonis.

