Figure 4.

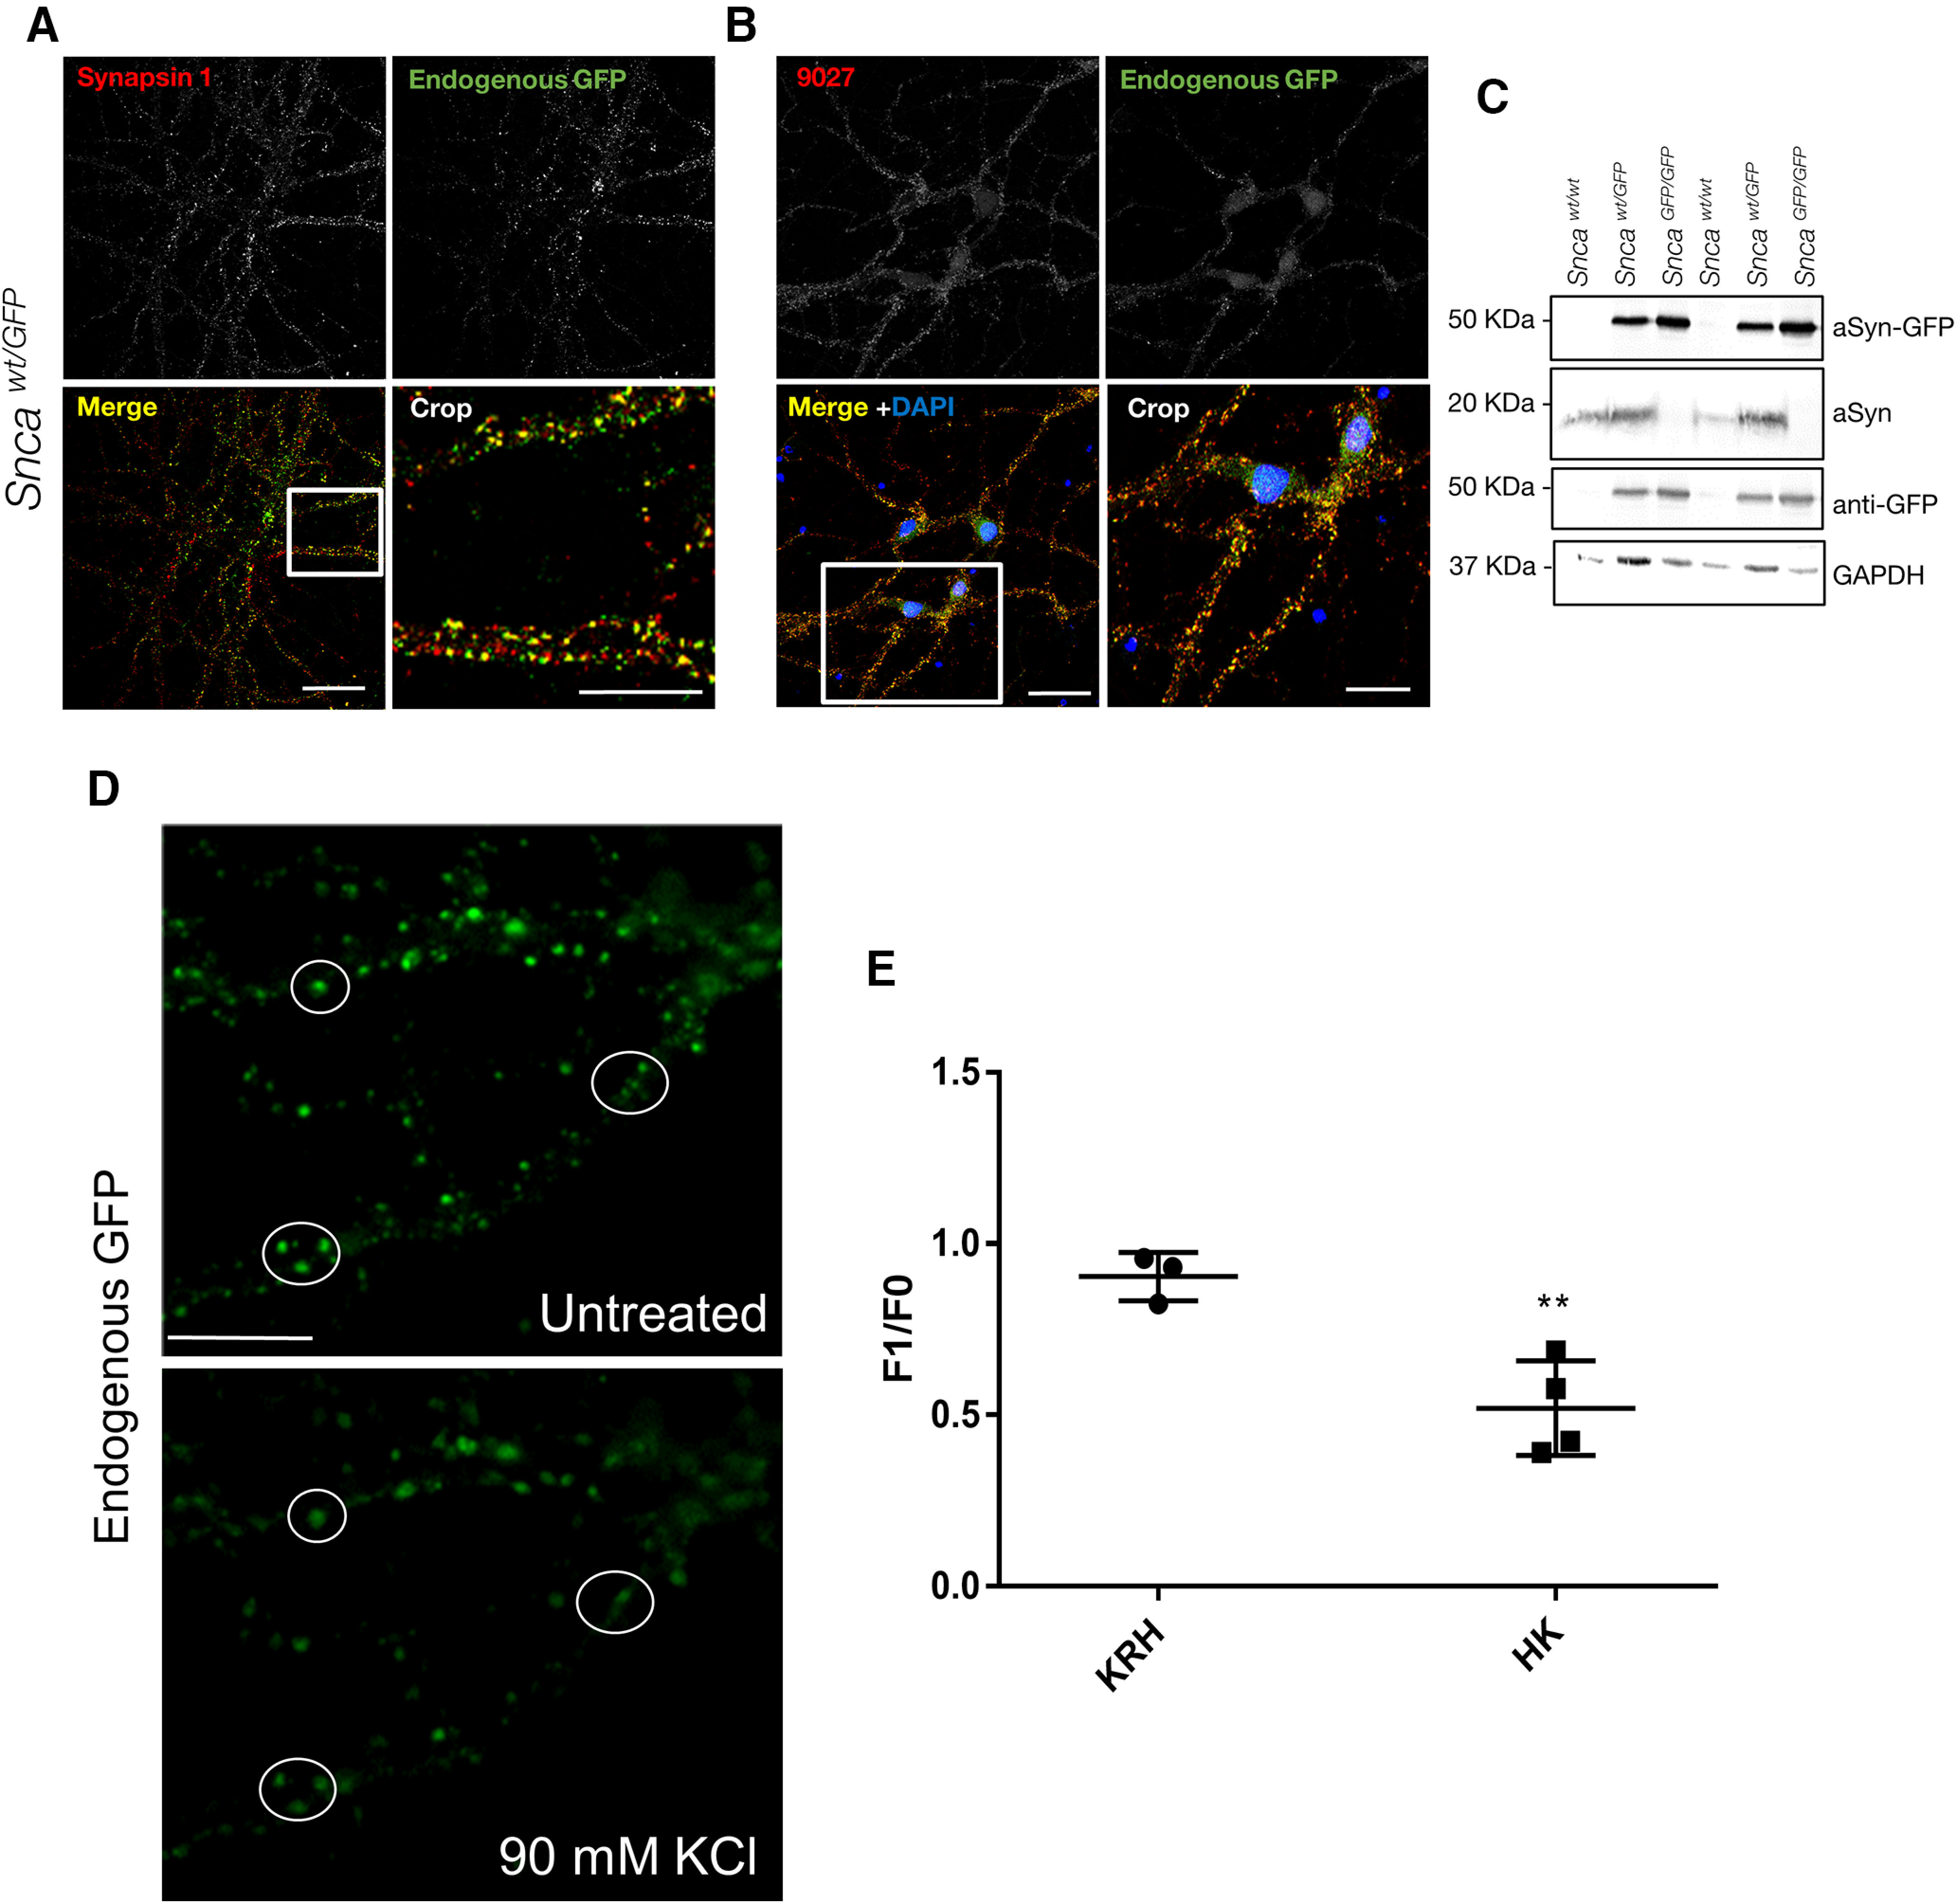
Expression, subcellular localization and synaptic vesicle cycle of aSyn-GFP in primary neurons. Primary hippocampal neurons were derived from newborn pups and kept in culture for 14–21 d. A, Co-localization of aSyn-GFP with the presynaptic marker Synapsin 1. B, Co-localization between endogenous GFP signal and an anti-aSyn antibody (9027) in Sncawt/GFP neurons. Immunocytochemistry showing distribution of aSyn in wt neurons is shown in Extended Data Figure 4-1. C, Western blotting of lysates from neurons of the indicated genotypes using antibodies against aSyn, GFP, and GAPDH. Complete blot is shown in Extended Data Figure 4-2. D, Heterozygous primary hippocampal neurons were imaged before and after stimulation with 90 mm KCl. E, Quantification of fluorescence intensity of GFP positive vesicles before (F0) and following (F1) treatment with control (KRH, Krebs Ringer HEPES) or stimulation buffer (HK, 90 mm KCl). The data are expressed as the F1/F0 ratio (mean ± SEM from two subfields per dish, >70 vesicles per dish, N = 3–4 dishes from two to three independent cultures). Asterisks indicate statistical significance (p = 0.0061) as determined by two-tailed unpaired Student’s t test with Welch’s correction. Comparison of aSyn and Synapsin 1 redistribution by immunostaining is shown in Extended Data Figure 4-3. Scale bars: 20 µm (A, B), 10 µm (crop), 10 µm (D).
