Figure 4.

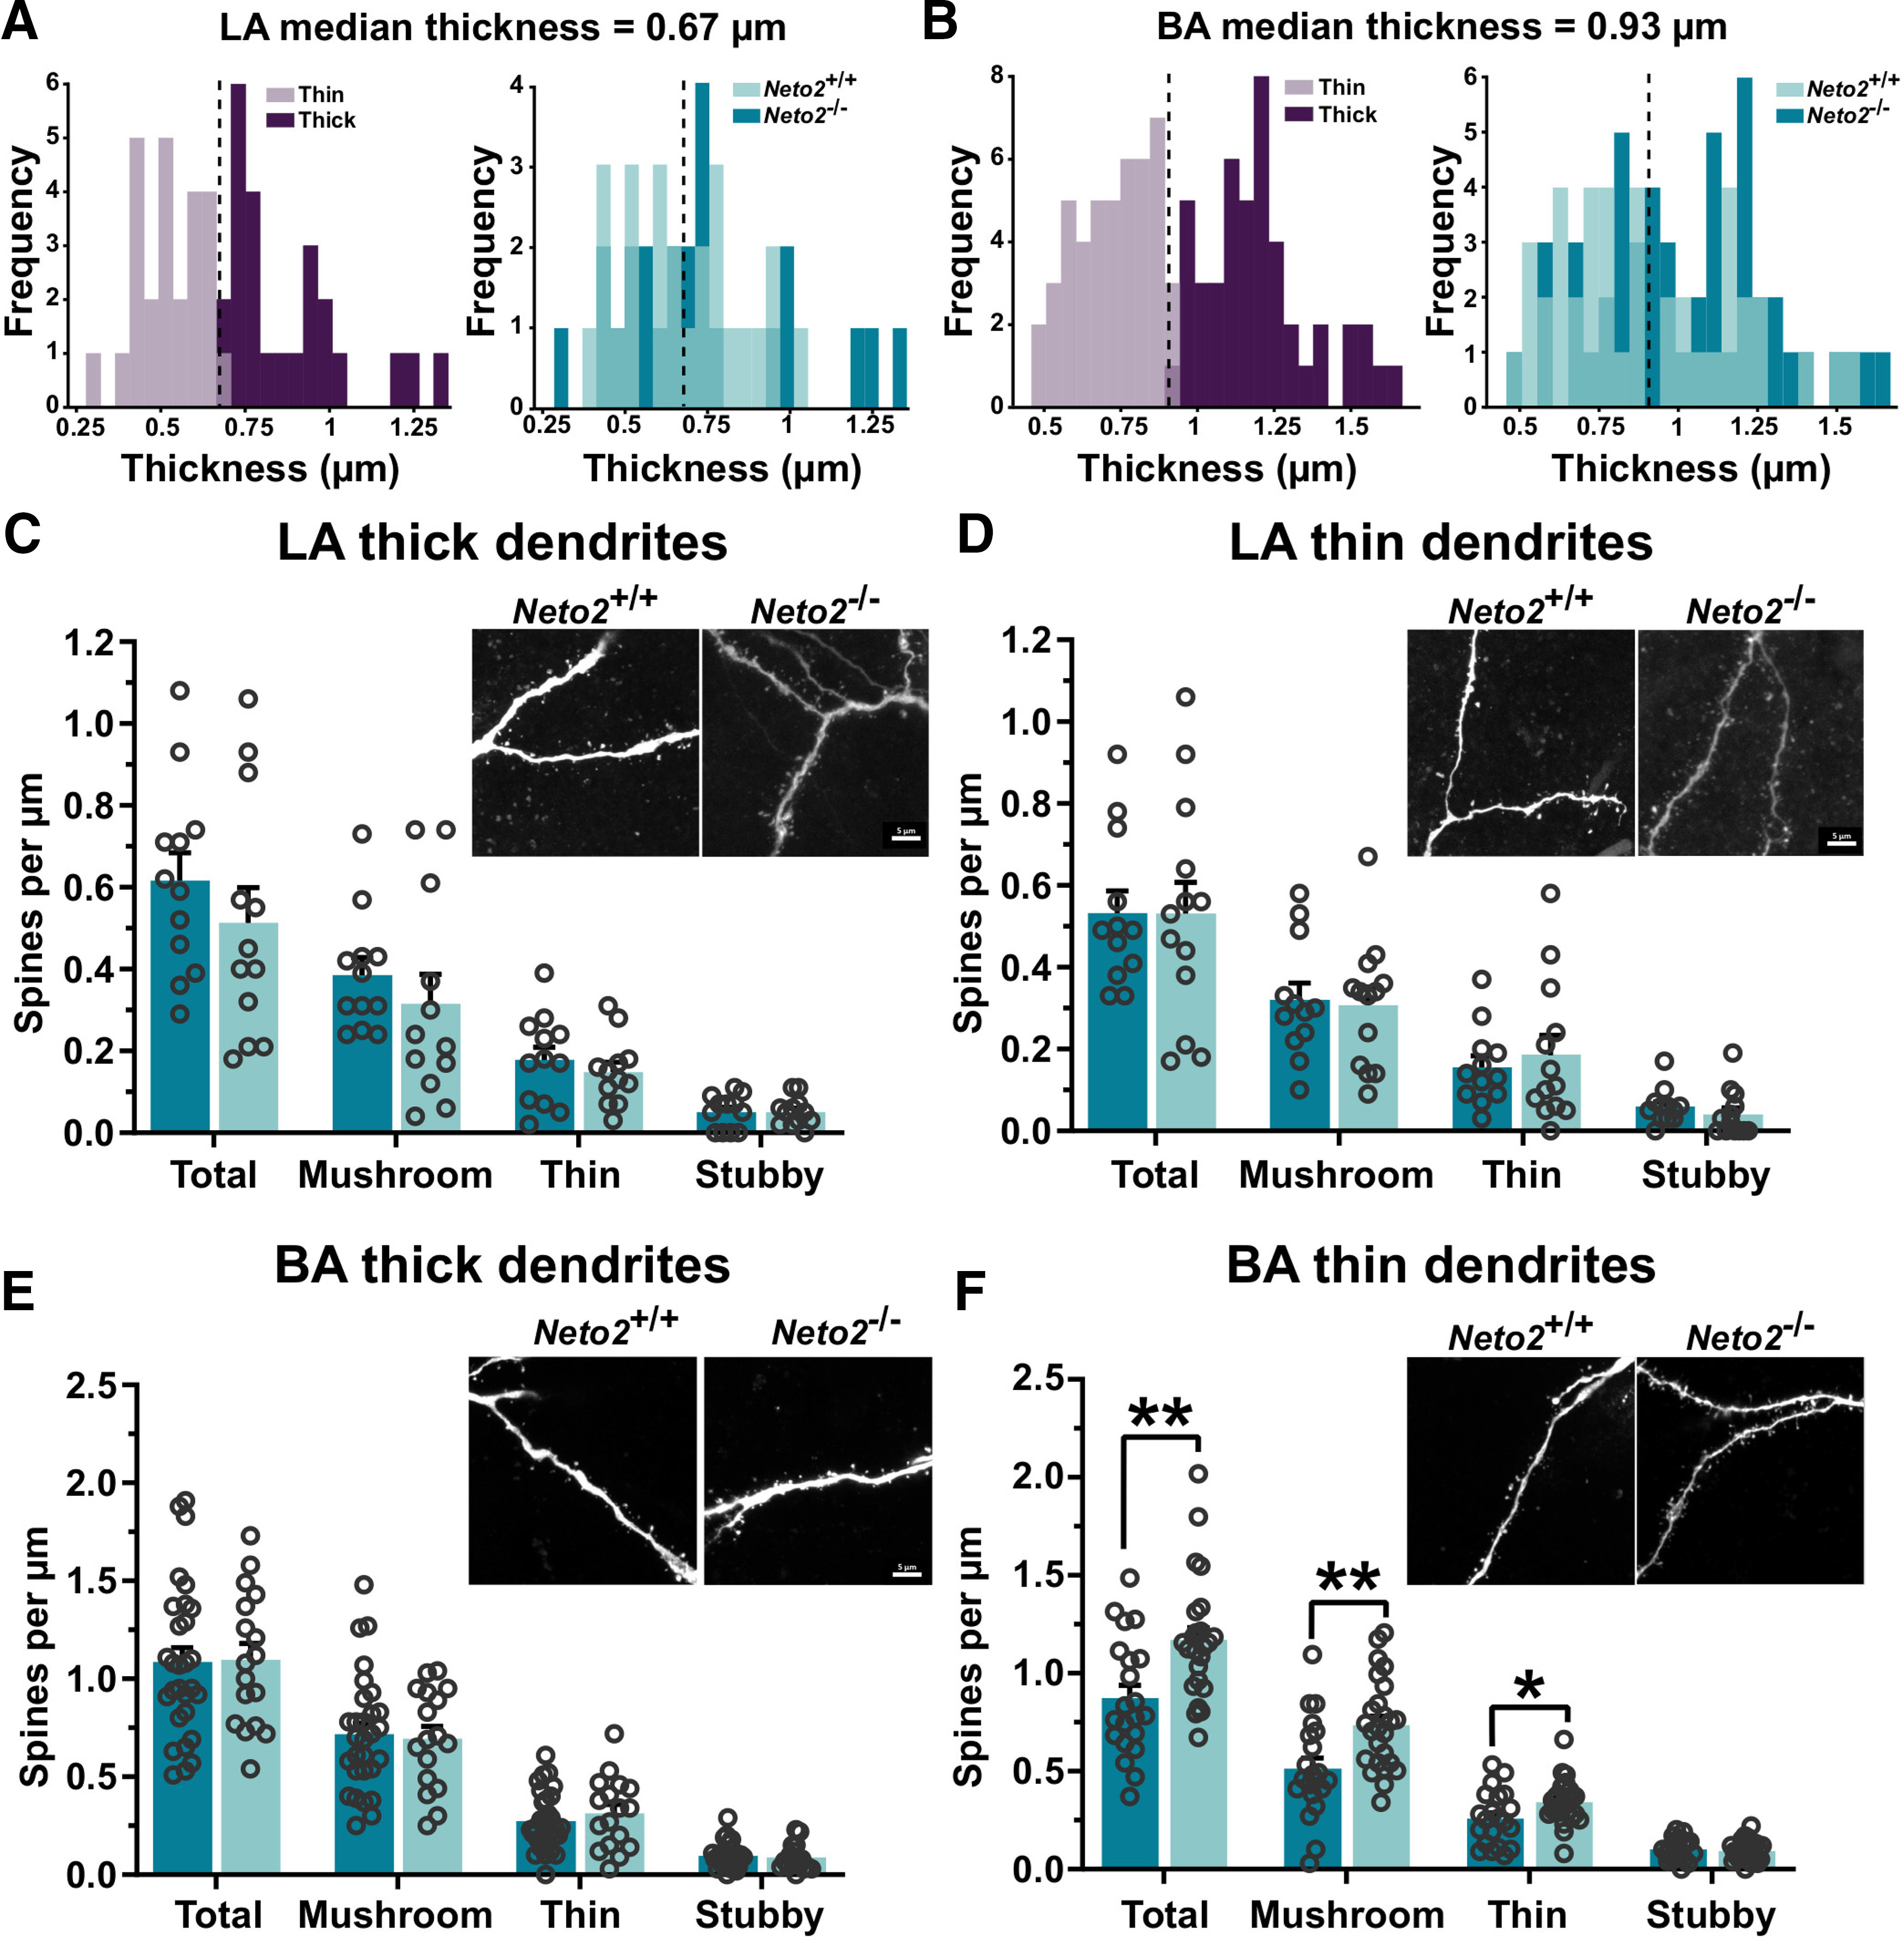
Increased dendritic spine density in the BA of Neto2−/− mice. Frequency plot of the dendrite thickness distribution, and division into thin and thick dendrite groups in (A) LA and (B) BA of adult Neto2+/+ and Neto2−/− mice. Density of spines within LA (C) thick (analyzed dendrites: WT n = 12, KO n = 12) and (D) thin dendrite groups (analyzed dendrites: WT n = 12, KO n = 13) from adult Neto2−/− and Neto2+/+ mice (mice: WT n = 5, KO n = 3). Density of spines within BA (E) thick (analyzed dendrites: WT n = 29, KO n = 17) and (F) thin dendrite groups (analyzed dendrites: WT n = 21, KO n = 25) of Neto2−/− and Neto2+/+ adult mice (mice: WT n = 10, KO n = 6). Each dot represents one dendrite. Mean ± SEM is shown. Genotype effect calculated using two-sample Kolmogorov–Smirnov test (A, B) or GEE analysis (C–F); *p < 0.05, **p < 0.01.
