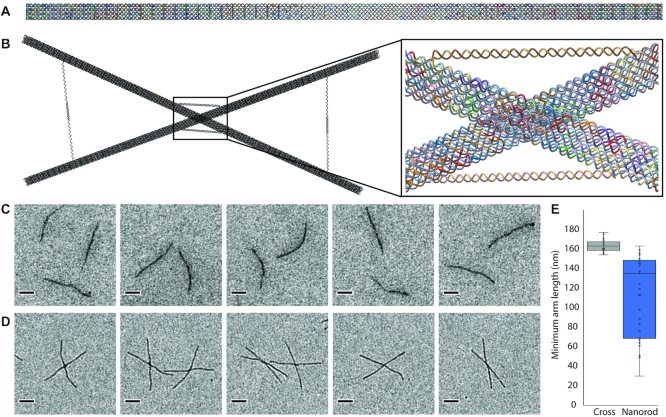
Figure 4.
The DNA origami nanorod (A) and the cross (B) as designed in Adenita. (C) Negative stain TEM micrographs taken of the control nanorods. (D) Negative stain TEM images of the cross. (E) Since some images of crosses can also appear when separate nanorods superimpose each other on the grid, a statistical analysis of the cross-arm's length was performed to check that crosses were correctly folded.

