Figure 1.

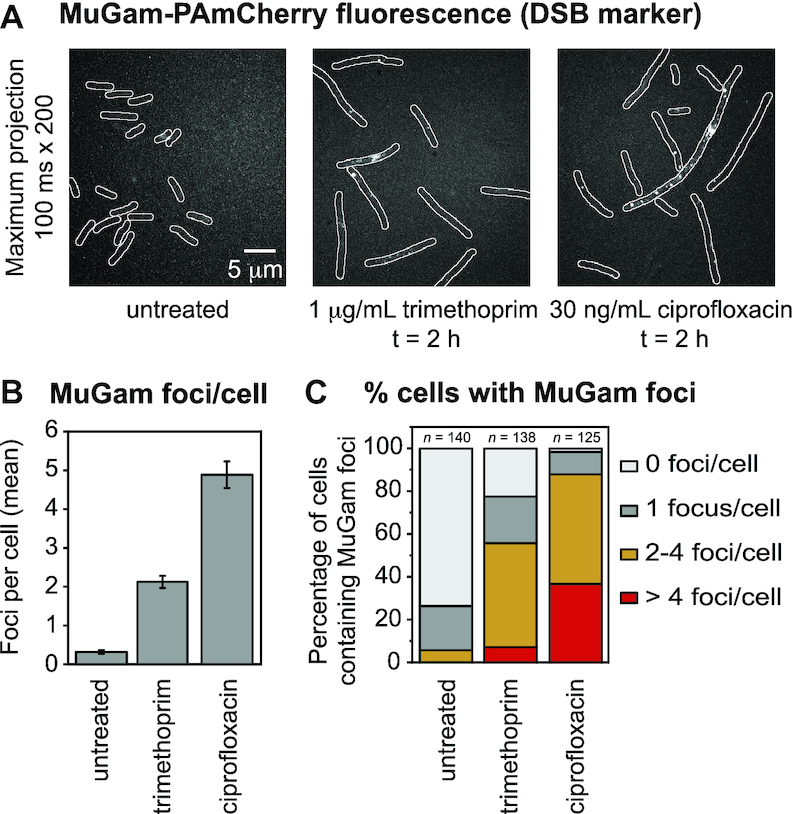
Number of MuGam-PAmCherry foci per cell following ciprofloxacin or trimethoprim treatment. Escherichia coli MG1655 cells carrying plasmid pEAW1162 were imaged on a single-molecule sensitive fluorescence microscope. (A) Fluorescence signal from MuGam-PAmCherry at 0.003% L-arabinose: maximum intensity projections over 200 × 100 ms frames showing MuGam-PAmCherry foci. From left to right: MuGam signal with no antibiotic, 2 h treatment with 1 μg/ml trimethoprim, 2 h treatment with 30 ng/ml ciprofloxacin. (B) Mean number of MuGam foci per cell. Cells were left untreated (n = 140), treated with 1 μg/ml trimethoprim (n = 138), or treated with 30 ng/ml ciprofloxacin (n = 125). The error bars represent standard error of the mean over the number of cells. * for P < 0.05; ** for P < 0.01 in two-sample t-test for differences of means. (C) Percentage of cells containing MuGam foci: 0 foci (light gray), 1 focus (gray), 2–4 foci (amber) and >4 foci (red). Cells were left untreated (n = 140), treated with 1 μg/ml trimethoprim (n = 138), or treated with 30 ng/ml ciprofloxacin (n = 125).
