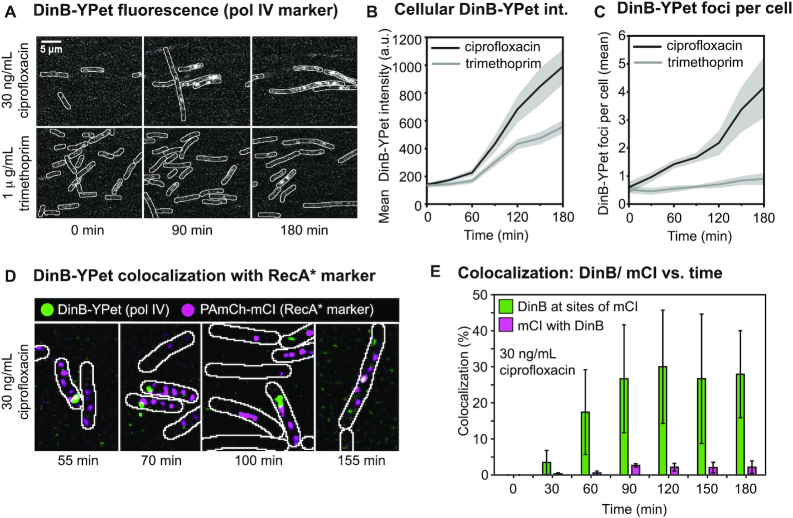
Figure 3.
Pol IV concentration and focus formation following ciprofloxacin or trimethoprim treatment and pol IV colocalization with RecA* structures. (A) Fluorescence images showing cells (EAW643) expressing DinB-YPet (Pol IV) at 0, 90 and 180 min (left to right) after trimethoprim (1 μg/ml) or ciprofloxacin (30 ng/ml) treatment (top to bottom). Scale bar represents 5 μm. (B) Cellular DinB-YPet intensities during treatment. Mean cell brightness is plotted against time (1 μg/ml trimethoprim: light gray line; 30 ng/ml ciprofloxacin: dark gray line). In this analysis the precise number of cells included is not determined but is well in excess of 100 cells at each time point. Gray-shaded error bands represent standard error of the mean. (C) Number of DinB-YPet foci per cell are plotted against time (1 μg/ml trimethoprim: light gray line; 30 ng/ml ciprofloxacin: dark gray line). In this analysis, the precise number of cells included is not determined but is well in excess of 100 cells at each time point. Gray-shaded error bands represent standard error of the mean. (D andE) Colocalization between DinB and mCI after ciprofloxacin treatment (30 ng/ml) in EAW633 cells transformed with pEAW1162. (D) Merged images of discoidal filtered DinB-YPet (green) and PAmCherry-mCI (magenta) images at 55, 70, 100 and 155 min after ciprofloxacin addition (30 ng/ml). (E) Colocalization percentages after ciprofloxacin addition (30 ng/ml): percentage of DinB-YPet foci that colocalize with mCI features (green); percentage of mCI features that colocalize with DinB-YPet foci. Time points are grouped into 30 min bins. Error bar represents standard deviation of biological quadruplicates.

