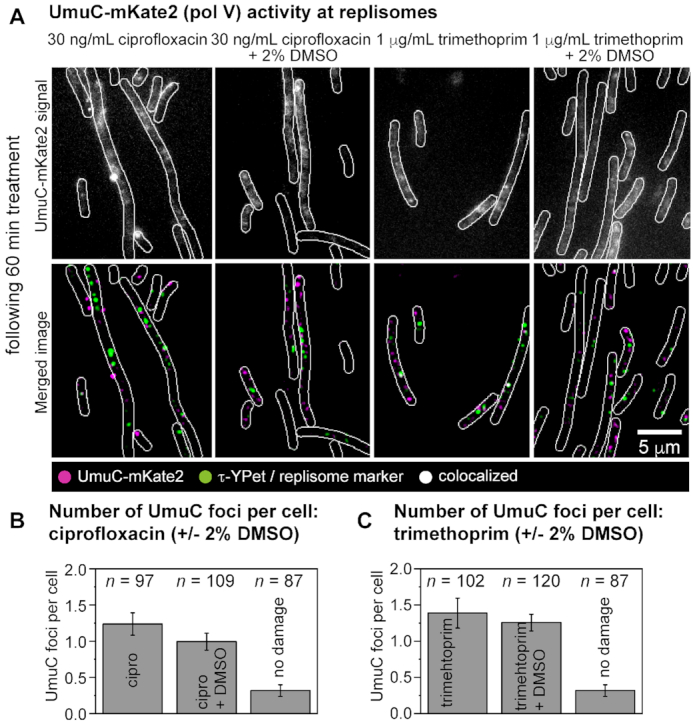
Figure 6.

Measuring the number of pol V foci per cell following ciprofloxacin (30 ng/mL) or trimethoprim (1 μg/ml) treatment under normal conditions or ROS-mitigating (2% DMSO) conditions in lexA(Def) cells. (A) Formation of UmuC-mKate2 foci in lexA(Def) cells (RW1286). Cells were treated for 60 min prior to imaging. Upper row: unfiltered image of an average projection showing UmuC-mKate2 foci that persist for >1 s (from left to right: ciprofloxacin, ciprofloxacin-DMSO, trimethoprim, trimethoprim-DMSO). Bottom row: merged image showing UmuC-mKate2 foci in magenta and DnaX-YPet foci in green (from left to right: ciprofloxacin, ciprofloxacin-DMSO, trimethoprim, trimethoprim-DMSO). Scale bar represents 5 μm. (B) Number of UmuC-mKate2 foci per cell of foci that persist for >1 s following ciprofloxacin treatments (30 ng/ml). Error bars represent standard error of the mean. Number of cells included in analysis: n(ciprofloxacin) = 97, n(ciprofloxacin-DMSO) = 109, n(untreated) = 87. (C) Number of UmuC-mKate2 foci per cell of foci that persist for >1 s following trimethoprim treatments (1 μg/ml). Error bars represent standard error of the mean. Number of cells included in analysis: n(trimethoprim) = 102, n(trimethoprim-DMSO) = 120, n(untreated) = 87.
