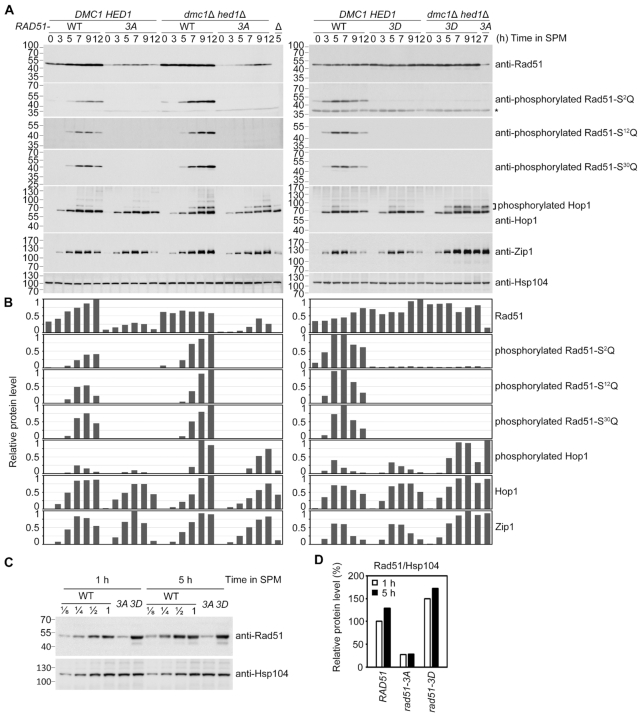
Figure 5.
Immunoblotting time-course analyses of WT and the indicated mutant strains were performed as previously described (25,34). (A) Total cell lysates were prepared from meiotic cells at indicated sporulation time-points and then visualized by immunoblotting with the corresponding antisera. Antisera against Zip1 and Hop1 were included as references for meiotic progression. Hsp104 was used as a loading control. Size in kilodaltons of standard protein markers is labeled to the left of the blots. The asterisk indicates non-specific bands. (B) Quantifications of the protein bands in (A) were normalized to those of Hsp104 at each time-point using ImageJ software and are shown as the relative steady-state levels of indicated proteins. The highest level of immunoblot signal in each blot was used as the standard for comparison. (C) Two-fold serial dilutions of WT cell lysates were used to estimate the Rad51 protein levels in rad51 mutants at 1 h and 5 h in SPM. (D) The protein levels of Rad51 variants from non-diluted lysates shown in (C) were quantified and normalized to Hsp104 levels. The Rad51 level of WT at 1 h in SPM was used as the standard.

