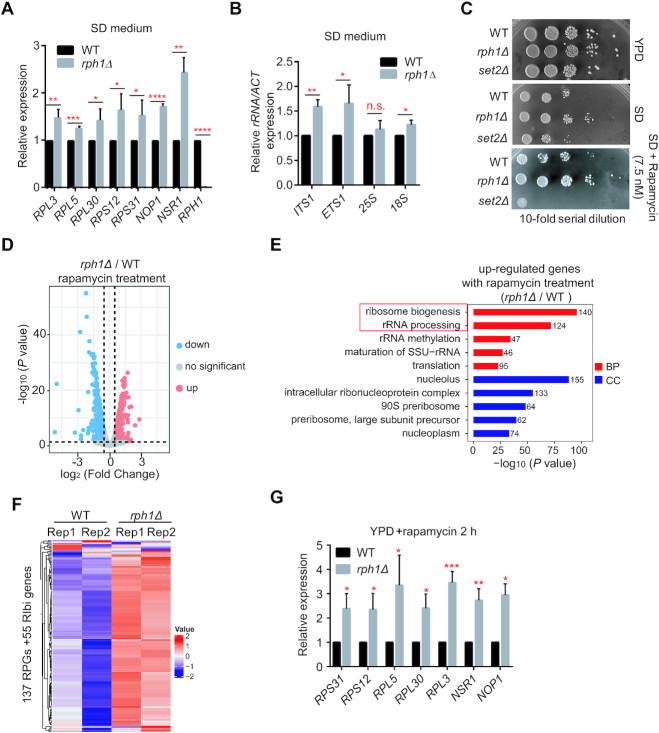
Figure 3.
Rph1 negatively regulates transcription of ribosomal genes under nutrient-limited and nutrient stress conditions. (A andB) Expression of representative RPGs (A) or the indicated 35S rRNAs loci (B) from WT and rph1Δ cells cultured in SD medium was examined by RT-qPCR analyses. (C) The indicated strains were spotted onto YPD or SD plates with or without rapamycin. (D) Volcano plots indicating the DEGs from overlapped two biological repeats in rph1Δ cells relative to WT cells with rapamycin treatment for 2 h. The vertical dashed gray lines in the plot represent log2 normalized fold changes of ±0.5. The horizontal dashed gray line represents an adjusted P value of 0.05. (log2(FC) > 0.5, P < 0.05). (E) GO analysis showed the top 5 enriched upregulated gene clusters based on DEGs in panel D by different pathways. BP: biological processes; CC: cellular components. (F) Expression heatmap of all RPGs and Rph1-enriched 55 Ribi genes in either rph1Δ or WT cells with rapamycin treatment. (G) Expression of representative RPGs and Ribi genes was validated by RT-qPCR. Data are represented as mean ± SD from three biological replicates. t-test, ∗P < 0.05; ∗∗P < 0.01; ***P < 0.001, **** P < 0.0001, n.s. ‘not significant’.

