Figure 5.
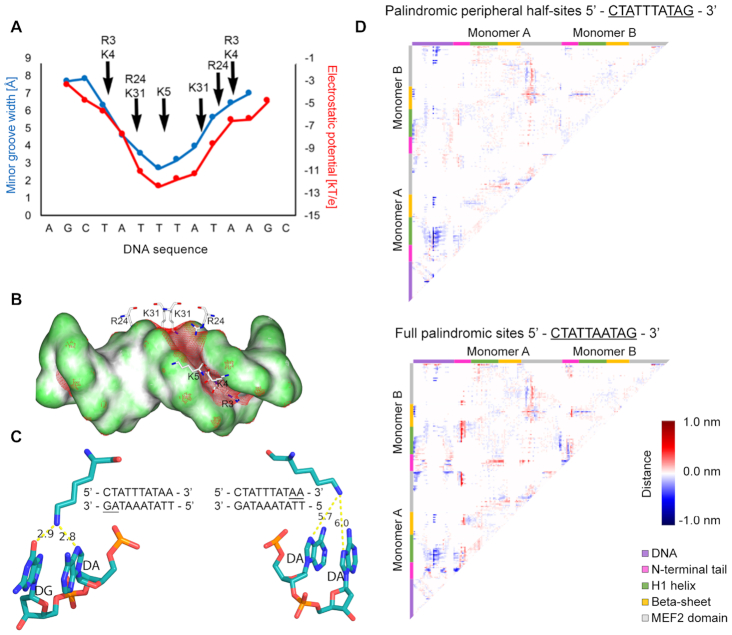
MEF2B residues recognize DNA shape. (A) Minor groove width and electrostatic potential plotted as function of sequence, based on analysis of co-crystal structures of MEF2B with DNA from PDB ID 1N6J (27). Supplementary Figure S8 shows consistency with co-crystal structures, including PDB ID 1TQE used as starting configuration for MD simulations. (B) Electrostatic potential of DNA shown on molecular surface of DNA. Red mesh represents regions with isopotential of −5 kT/e. Positively charged MEF2B residues near minor groove are shown in stick representation. (C) Snapshot of interactions between K23 and DNA. Bases interacting with K23 are underlined. Panels display interactions between K23 and regions 3′ (left panel) or 5′ (right panel) of the A-tract. Snapshot was obtained from the most representative structure of MD simulations based on the main cluster. (D) Difference contact map between MEF2B−DNA complex with DNA substitutions and co-crystal structure with PDB ID 1TQE shows changes in distance matrices induced by DNA substitutions. Negative differences represent regions that are closer in contact. Positive differences represent regions that are further away. Map edges are color-coded to represent specific regions of the protein as described in the figure.

