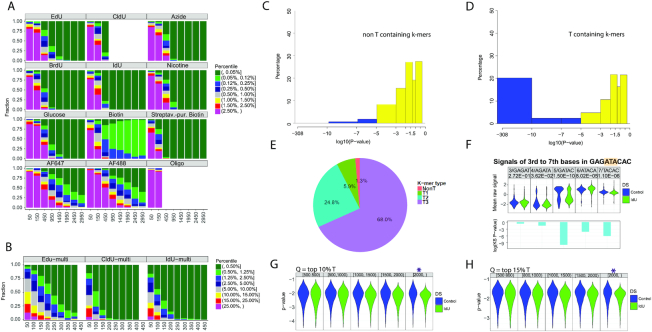
Figure 3.
Detection of IdU, incorporated into replicating mammalian DNA. Computational modeling to determine the sequencing depth, required for calling base analogs in mixed samples of modified and unmodified reads, using (A) single modified base templates, (B) multi-modified templates. The X axis represents the number of reads used for the analysis, and the Y axis shows the fraction a modified site can be ranked by percentile among all sites for each sample. Analysis was performed using Stouffer's combined statistic. IdU and CldU modifications cause the strongest signal shifts and require the least number of reads for reliable detection. (C) combined P-values calculated with Stouffer's method for non-T containing 9-mers in the mouse genome. The combined P-value includes P-values for the central base of the 9-mer, as well as, 2 bases upstream and downstream. (D) Combined P-values for T-containing k-mers in the mouse genome. All T-containing 9-mers were considered, including ones with multiple Ts. (E) Pie chart showing the percentage of 9-mers with P-values less than 10−7. Non-T, 1T, 2T and 3T-containing k-mers are shown in red, green, blue and purple, respectively. (F). Signal changes as a selected 9-mer from IdU-substituted mouse genomic DNA with the sequence GAGATACAC was separated in five different k-mers. The k-mers were covered by 200–400 reads. (G) Detection of single modified reads. The ranges of read lengths are indicated at the top of the panel. The purple star indicates the read length required for the detection of individual IdU-substituted genomic DNA reads when integrating signals from k-mers with P-values in the 10% and the H). 15% percentile. Q = quantile.

