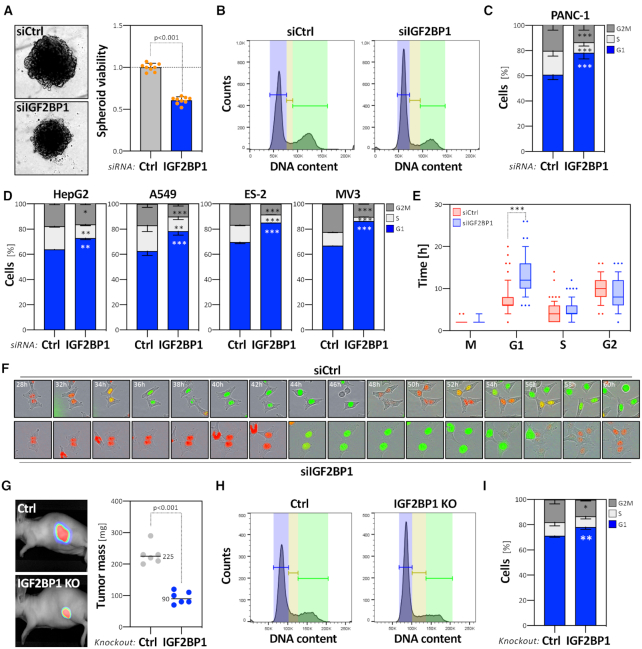
Figure 2.
IGF2BP1 promotes proliferation and cell cycle progression in cancer cells. (A) PANC-1 cells were transfected with control (siCtrl, gray) or IGF2BP1-directed siRNA pools (siIGF2BP1, blue). Representative PANC-1 spheroids 6 days post-transfection are indicated in the left panel. The viability of PANC-1 spheroids was determined by CellTiter GLO (right panel). Orange dots represent median-normalized values of three spheroids analyzed in three independent studies. (B–D) PANC-1 cell cycle phase distribution upon transfection with control (B, left panel) or IGF2BP1-directed (B, right panel) siRNAs, as determined by PI-labeling and flow cytometry. Fractions of PANC-1 (C) or HepG2, A549, ES-2 and MV3 (D) cells in each cell cycle phase were quantified in three independent knockdown analyses. (E) Box plots showing the duration of cell cycle phases upon control (siCtrl, red) or IGF2BP1-depletion (siIGF2BP1, blue). ES-2 cells were stably transduced with the FUCCI system (Sartorius). The length of cell cycle phases was determined over 66 (control, red) and 80 (IGF2BP1-depleted, blue) cell divisions. (F) Representative images of cells with segmentation mask overlays analyzed in (E) at indicated time post transfection with control- (upper panel) or IGF2BP1-directed (bottom panel) siRNAs. Red, G1 phase; Green, G2 phase; Yellow, S phase. (G) Parental (Ctrl) and IGF2BP1-deleted (KO) A549 cells expressing iRFP were injected (sc) into nude mice (6 mice per condition) and the growth of xenograft tumors was monitored by near-infrared imaging. Representative images are shown in the left panel (42 days post-injection). Final tumor mass is shown by box plots (right panel). (H, I) Cell cycle analysis, as presented in (B, C) of parental and IGF2BP1-deleted A549 cells. Statistical significance was determined by Mann–Whitney test: *P <0.05; **P < 0.01; ***P < 0.001.

