Figure 6.
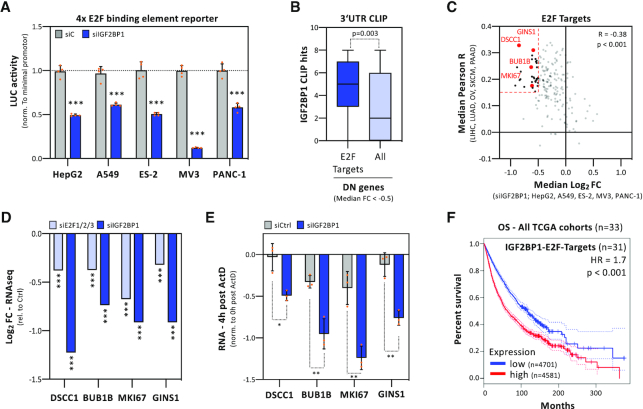
IGF2BP1 is a post-transcriptional enhancer of E2F-driven genes. (A) E2F-responsive promoter studies. Luciferase activities, normalized to minimal promoter activity, were determined in indicated cancer cells upon control- (gray) or IGF2BP1-depletion (blue) in four independent experiments. (B) Box plots of IGF2BP1 CLIP hits in the 3′UTR of mRNAs showing a median log2FC < –0.5 upon IGF2BP1 depletion, as determined in five cancer cell lines (see Figure 3A). E2F Targets, n = 196; All, n = 1280. (C) The median correlation coefficient (R) of E2F target genes with IGF2BP1 in indicated primary cancers was plotted against the median log2FC observed upon IGF2BP1 depletion in indicated cancer cells. Dashed lines distinguish genes with R > 0.15 and log2FC←0.5 (n = 31). (D) Log2 FC of DSCC1, BUB1B, MKI67 and GINS1 upon E2F1/2/3- or IGF2BP1-depletion in PANC-1 cells, as determined by RNA seq. (E) mRNA decay of indicated genes was monitored by RT-q-PCR in control- (gray) or IGF2BP1-depleted (blue) PANC-1 cells upon 4h of Actinomycin D (ActD) treatment and normalized to RNA levels prior ActD treatment. Error bars indicated standard deviation in three independent studies. RPLP0 served as internal normalization control. (F) Kaplan–Meier plots of overall survival analyses (median cutoff) based on the expression of 31 IGF2BP1 and E2F target mRNA (as shown in C) expression. Overall survival was analyzed for all 33 TCGA tumor cohorts (9282 patients). HR, hazard ratio; P, logrank P value. Statistical significance was determined by Mann–Whitney test: *P < 0.05; **P < 0.01; ***P < 0.001.

