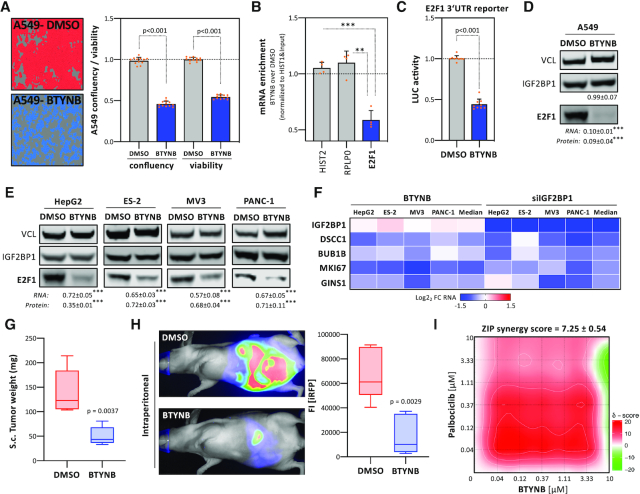
Figure 7.
BTYNB impairs IGF2BP1’s post-transcriptional super-enhancer function in E2F-driven gene expression. (A) A549 cells were treated with DMSO (red) or 5 μM BTYNB (blue) for 48 h. Representative images are indicated in the left panel. Cell confluency and viability were determined by an IncuCyte S3 analyzer and CellTiter GLO (right panel). (B) Co-purification of mRNAs with IGF2BP1 in A549 cells upon treatment with 5 μM BTYNB (48 h) was analyzed by immunoprecipitation using anti-IGF2BP1 antibodies and RT-q-PCR analysis. HIST2 and RPLP0 served as negative controls. HIST1 served as normalization control. (C) E2F1 3′UTR luciferase activity in A549 cells upon DMSO- or BTYNB (5 μM) treatment. Reporter activities were determined in three independent experiments, including three technical replicates each, as described in Figure 4B. (D, E) Western blot analysis of E2F1 protein level upon DMSO or BTYNB (5 μM, 48 h) treatment in indicated cancer cells. The fold change of E2F1 protein and mRNA levels, determined by RT-q-PCR, upon BTYNB treatment is indicated in bottom panel. (F) Heatmap showing log2 FC of indicated mRNAs upon 5 μM BTYNB treatment (left) or IGF2BP1 depletion (right) in indicated cancer cells. (G, H) iRFP-labeled ES-2 cells were treated with DMSO or 5 μM BTYNB for 24h and injected sc (G) or ip (H) into nude mice (5 mice per condition). The mass of final sc tumors (G) is shown by box plots. Representative images indicating iRFP-labeled intraperitoneal tumors are shown in the left panel (H). The total, final iRFP fluorescence intensity (FI) of ip tumor burden is indicated by box plots (H, right panel). (I) Relief plot showing the ZIP synergy for combined treatment with BTYNB and Palbociclib (72 h) at indicated concentrations in 2D-cultured ES-2 cells. Cell viability was determined using Cell Titer GLO. Synergy maps were generated using the SynergyFinder web application (https://synergyfinder.fimm.fi, (31)). ZIP (zero interaction potency) synergy scores were determined in four independent experiments. Synergy scores are color-coded (scores < –10, antagonistic, green; scores > 10, synergistic, red). Statistical significance was determined by Mann–Whitney test: *P <0.05; **P < 0.01; ***P < 0.001.

