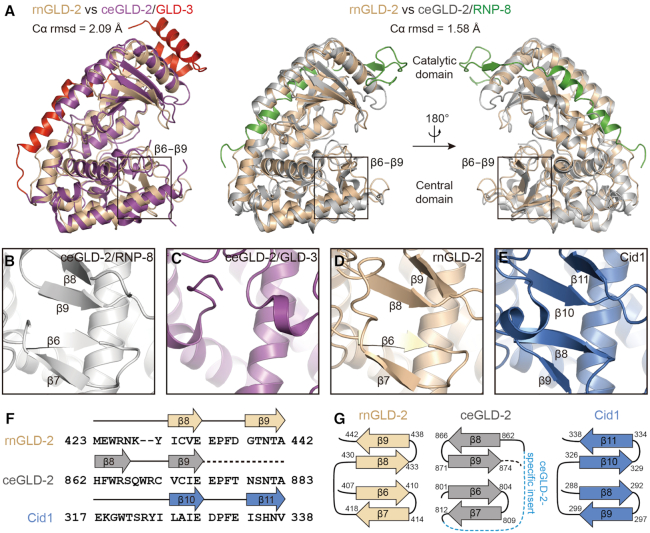
Figure 2.
Structure comparison between rnGLD-2 and ceGLD-2. (A) Structural superposition of rnGLD-2 with ceGLD-2 complexed with GLD-3 (left, PDB code: 4zrl) or with RNP-8 (right, PDB code: 5jnb). The β6−β9 regions are indicated. (B andC) Structural details of ceGLD-2 at the tip of the central domain when complexed with RNP-8 (B) or with GLD-3 (C). (D andE) The β-sheet at the central domain of rnGLD-2 (D) and Cid1 (E). (F) Sequence alignment for β8−β9 of GLD-2s from various species and corresponding β10−β11 of Cid1. Residues after β9 of ceGLD-2 that are missing in the structural model are indicated by a dashed line. (G) Comparison of the β-sheet at the central domain for rnGLD-2, ceGLD-2 and Cid1 shown as topology diagrams. The ceGLD-2 specific insert is indicated as a blue dashed line. Note the difference in the arrangement of β8 and β9 between rnGLD-2 and ceGLD-2.

