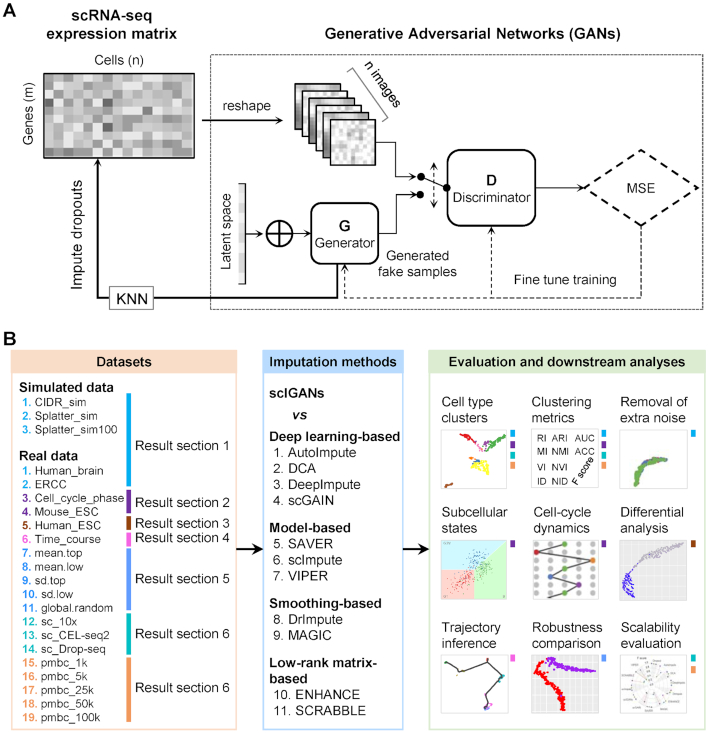
Figure 1.
Overview of generative adversarial networks for single-cell RNA-seq imputation and systematic evaluations. (A) The high-level architecture of scIGANs. The expression profile of each cell is reshaped to a square image, which is fed to the GANs (Supplementary Figure S1A). The trained generator is used to generate a set of realistic cells that are used to impute the raw scRNA-seq expression matrix (Supplementary Figure S1B). KNN, k-nearest neighbors. MSE, mean squared error. (B) A schematic view of the datasets and strategies used for benchmark comparison between scIGANs and other 11 imputation methods. Colored bars in the right panel indicate the corresponding analyses and evaluations present in the result sections and datasets defined in the left panel. Also see Supplementary Figure S1.

