Figure 2.
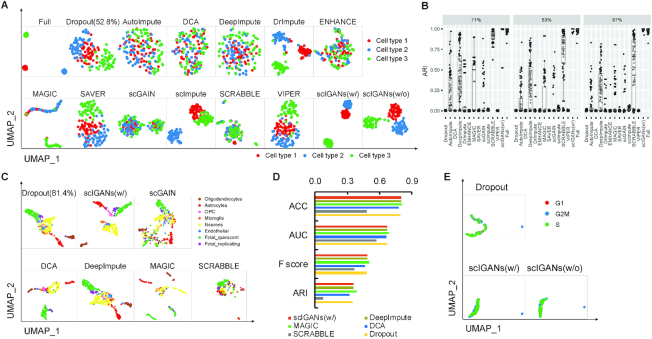
ScIGANs recovers single-cell gene expression from dropouts without extra noise. (A) The UMAP plots of the CIDR simulated scRNA-seq data for Full, Dropout, and imputed matrix by 12 methods. Multiple clustering measurements are provided in Supplementary Figure S2A and Table S2. (B) The adjusted rand index (ARI), a representative clustering measurement to indicate performance and robustness of all methods on the Splatter simulated data with three different dropout rates (71%, 83%, and 87%) and 100 replicates for each. Full list of clustering measurements provided in Supplementary Table S4. (C) The selected UMAP plots of real scRNA-seq data for the human brain. (D) The selected clustering measurements for the scRNA-seq data of the human brain. ACC, accuracy; AUC, area under the curve of ROC (receiver operating characteristics); F score, the harmonic mean of precision and recall; NMI, normalized mutual information. The full list of all considered clustering measurements is provided in Supplementary Table S5. (E) The evaluation of robustness in avoiding extra noise using scRNA-seq data of spike-in RNAs. All UMAP plots are provided in Supplementary Figure S3H. Also see Supplementary Figures S2 and S3.

