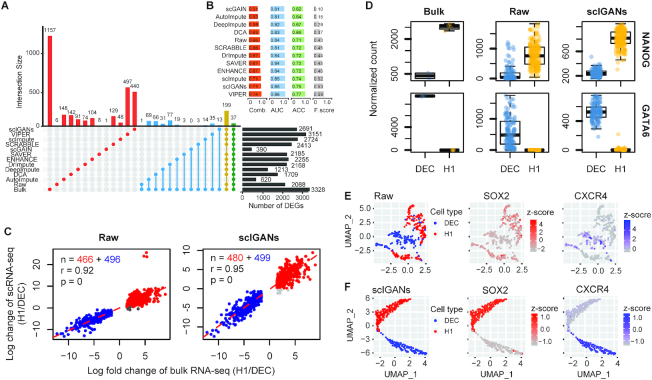
Figure 4.
ScIGANs increases the correspondence between single-cell and bulk differential expression analysis. (A) The correspondence of differentially expressed genes (DEGs) between bulk and single-cell RNA-seq with different imputation approaches. The yellow and green bars (connoted dots) highlight the poorest agreement of AutoImpute and scGAIN with all other methods. (B) The barplots show the performances of DEG detections from raw and imputed scRNA-seq datasets based on the gold standard defined by the bulk RNA-seq dataset. F score, the harmonic mean of precision and recall; AUC, area under the curve of ROC (receiver operating characteristics); ACC, accuracy; Comb., the combined overall performance as the average of the AUC, ACC and F score. (C) The correlations between log fold-changes of differentially expressed genes from bulk and single-cell RNA-seq datasets. Detailed legends and the plots of results from all other imputation methods are provided in Supplementary Figure S5. (D) The expression for one of five selected signature genes of H1 and DEC cells, respectively. All plots of other genes with different imputation methods are provided in Supplementary Figure S6. (E, F) The UMAP plots of the single cells overlaid by the expression of SOX2 and CECR4, which is the marker gene of H1 and DEC cells, respectively. Raw (E) and scIGANs imputed (F) data are shown and data from all other methods are provided in Supplementary Figure S7. Also see Supplementary Figures S5–S7.

