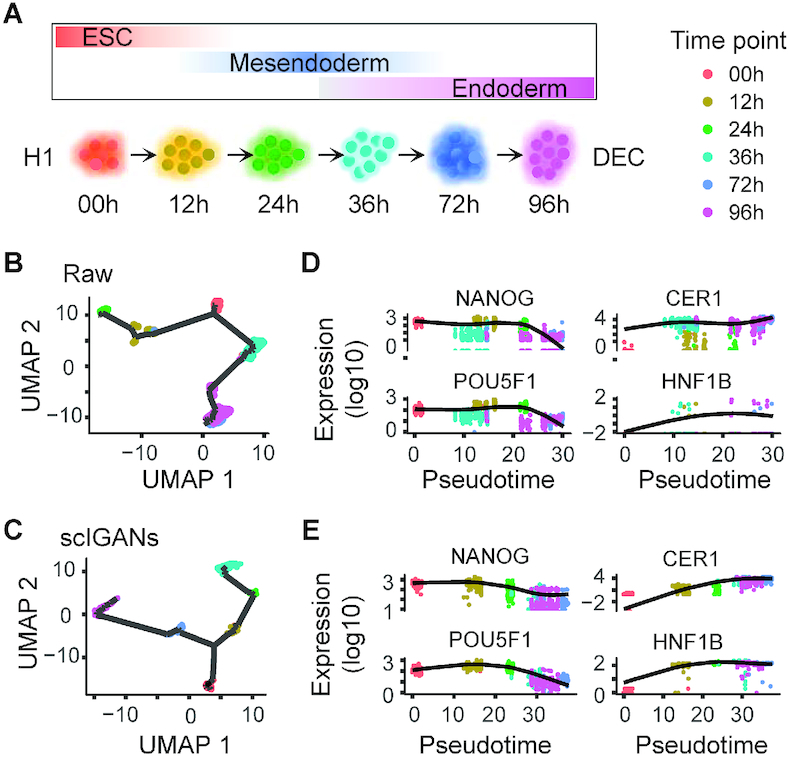
Figure 5.

scIGANs improves time-course scRNA-seq data analysis and reconstructing differentiation trajectory. (A) The time points of scRNA-seq sampling along with the differentiation from the pluripotent state (H1 cells) through mesendoderm to definitive endoderm cells (DEC). (B, C) The trajectories reconstructed by monocle3 from the raw (C) and scIGANs imputed (D) scRNA-seq data. (D, E) The expression dynamics of two pluripotent (left) and DEC (right) signature genes are shown in the order of the pseudotime. The plots of all other imputation methods are provided in Supplementary Figure S8. Also see Supplementary Figure S8.
