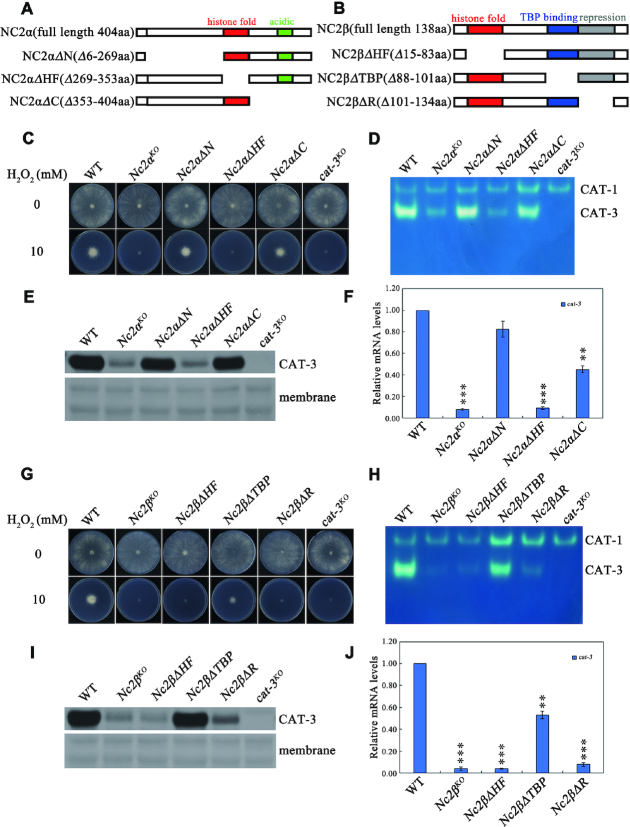
Figure 3.
Conserved regions of NC2 subunits are required for transcriptional activation of cat-3. (A, B) Schematic drawing of N. crassa NC2α (A) and NC2β (B) subunits and their various deletion mutants. The position of the histone fold (red rectangle), acidic (green rectangle), TBP-binding (blue rectangle) and repression (gray rectangle) regions are indicated. (C) Plate assays analyzing mycelial growth of different deletion strains across NC2α coding region at endogenous locus on plates with 0 or 10 mM H2O2. Cultures were inoculated in plates at 25°C under constant light. (D) In-gel assay analysis of the CAT-3 activity levels in different deletion strains across NC2α coding region at endogenous locus. (E) Western blot analyses showing the levels of CAT-3 protein in different deletion strains across NC2α coding region at endogenous locus. The membrane stained by coomassie blue represents the total protein in each sample and acts as loading control for western blot. (F) RT-qPCR assays analyzing the levels of cat-3 mRNA in different deletion strains across NC2α coding region at endogenous locus. Error bars show s.d. (n = 3). Significance was evaluated by using a two-tailed t-test. **P < 0.01 and ***P < 0.001 versus WT. (G) Plate assays analyzing mycelial growth of different deletion strains across NC2β coding region at endogenous locus on plates with 0 or 10 mM H2O2. Cultures were inoculated in plates at 25°C under constant light. (H) In-gel assay analysis of the CAT-3 activity levels in different deletion strains across NC2β coding region at endogenous locus. (I) Western blot analyses showing the levels of CAT-3 protein in different deletion strains across NC2β coding region at endogenous locus. The membrane stained by coomassie blue represents the total protein in each sample and acts as loading control for western blot. (J) RT-qPCR assays analyzing the levels of cat-3 mRNA in different deletion strains across NC2β coding region at endogenous locus. Error bars show s.d. (n = 3). Significance was evaluated by using a two-tailed t-test. **P < 0.01 and ***P < 0.001 versus WT.

