Figure 2.
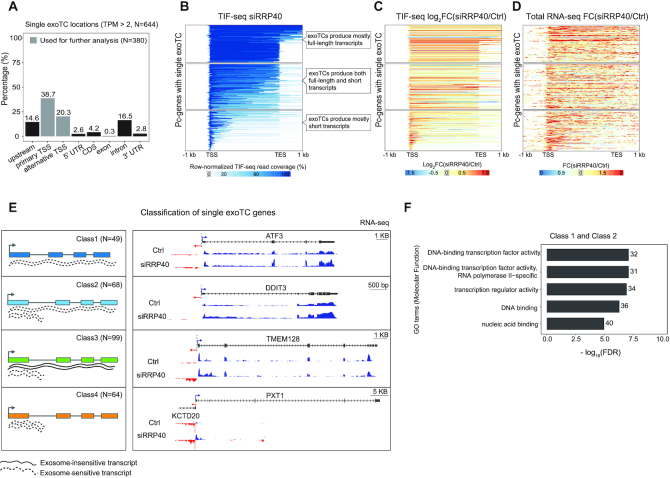
Characterization of transcripts from single exoTC-containing pc-genes. (A) Overlap between single exoTCs and genic annotation. Y-axis shows the percentage of single exoTCs overlapping the respective gene annotation features (X-axis), visualized as in Figure 1B. Gray shading indicates the set of single exoTCs analyzed in Figures 2–5, and referred to as single exoTCs. (B) Coverage of RNAs produced from single exoTCs by TIF-seq. Each row corresponds to one pc-gene body, with added flanking regions (1 kb in both directions), where the ‘TSS’ position corresponds to the exoTC and the ‘TES’ position corresponds to the GENCODE-annotated transcript 3′ end. Blue bars show TIF-seq read coverage from siRRP40 samples, where the 5′- and 3′-end reads are connected by a blue line. Line color intensity shows the row-normalized relative TIF-seq coverage (see MATERIALS AND METHODS), and white color indicates the absence of TIF-seq reads. Blue lines crossing the TES positions are due to transcripts harboring multiple, distinct 3′ ends. Subpanels with callouts show cases where the majority of TIF-seq reads cover the whole gene (top), cases where most RNAs are prematurely terminated (bottom) and cases with a mixture of RNA lengths (middle). (C) TIF-seq-derived exosome sensitivity of RNAs produced from single exoTCs. Heat map representation following the same conventions as in B, but with color intensities showing siRRP40 versus Ctrl TIF-seq log2 FC in 5 bp windows. Genes were sorted in the same order as in B. (D) RNA-seq-derived exosome sensitivity of RNAs produced from single exoTCs. Heat map representation following the same convention as in C, but using RNA-seq data to calculate FC and only analyzing exonic regions within each gene. Genes were sorted in the same order as in B. (E) Classification of single exoTC genes. Left sub-panel shows cartoons of features characterizing each class. Lines beneath gene models depict the RNAs produced. Dotted lines indicate exosome-sensitive RNAs, solid lines indicate exosome-insensitive RNAs. Right sub-panel shows genome-browser examples of each class with RNA-seq tracks from siRRP40- and Ctrl-libraries (average normalized signal per bp across triplicates) at each strand, where blue color indicates the same strand as the exoTCs, while the red color indicates the opposite strand. TSSs on each strand are indicated by arrows. RefSeq gene models (67) are shown on top. (F) Gene Ontology (GO) over-representation analysis of Class 1 and 2 genes. X-axis shows -log10(FDR) of top 5 terms. Numbers on the right of each bar indicate the number of genes from the two classes annotated with the respective GO term.

