Figure 7.
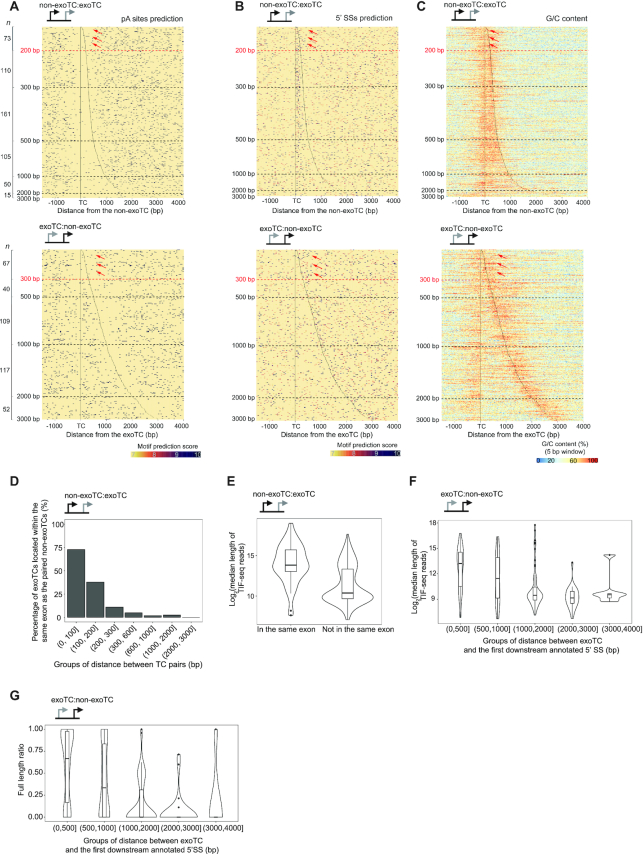
Analysis of the relation between TC pair distance, sequence content and transcription outcome. For all plots, the type of TC pairs analyzed is shown as a schematic on top. (A) Heat map representation of predicted pA sites around TCs in non-exo:exoTC pairs (top panel) and exoTC:non-exoTC pairs (bottom panel). The heat maps were organized as in Figure 6C. Positions of TCs are indicated by black lines. Dots indicate predicted pA sites, where the color intensity indicates the motif prediction score (see MATERIALS AND METHODS). Number of analyzed TCs per distance category are indicated on the left side. Dashed lines indicate specific distances between TCs. Red dashed lines (at 200 and 300 bp distances, respectively) and red arrows refer to specific main text discussion points. (B) Heat map representation of predicted 5′SSs around TCs in non-exoTC:exoTC pairs (top panel) and exoTC:non-exoTC pairs (bottom panel). Heat map follows the same convention as in A, but with dots representing predicted 5′ SSs. (C) Heat map representation of G/C content around TCs in non-exoTC:exoTC pairs (top panel) and exoTC:non-exoTC pairs (bottom panel). Heat map follows the same convention as in A, but with color representing G/C content calculated in the same way as in Figure 3G. (D) Exonic overlap of exoTCs in non-exoTC:exoTC pairs. Y-axis shows the percentage of exoTCs, that are within the same exon as their paired non-exoTCs, split by TC pair distance. (E) Distribution of lengths of transcripts starting from exoTCs in non-exoTC:exoTC pair as split by exonic overlap. Y-axis shows the log2-scaled median length of TIF-seq reads starting at the exoTC. X-axis shows whether the exoTC is located within the same exon as the paired non-exoTC. (F) Distribution of lengths of transcripts starting from exoTCs in exoTC:non-exoTC pairs. Combined violin-boxplots show the distribution of log2-scaled median length of TIF-seq reads starting from exoTCs, split by their distance to the first downstream annotated 5′ SS in bp (X-axis). (G) Distribution of ratio of full-length transcripts from exoTCs in exoTC:non-exoTC pairs. For each exoTC, a full-length TIF-seq read ratio was calculated, where 1 corresponds to the case where 100% of the TIF seq reads starting at the exoTC reaches the annotated gene 3′ end. Combined violin-boxplots show the distribution of this ratio for all exoTCs in exoTC/non-exoTC pairs, split by splice site distance as in F (X-axis).

