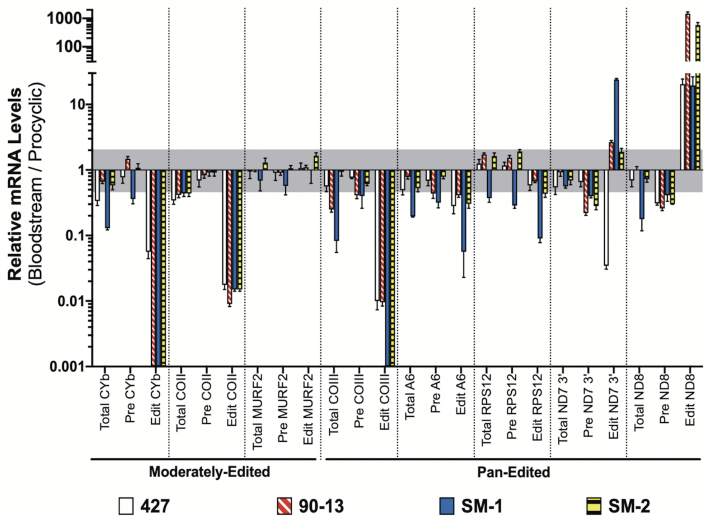
Figure 1.
Quantitative RT-PCR analysis of PCF and BSF mRNAs. Relative mRNA levels for total, pre-edited (Pre) and edited (Edit) mitochondrial mRNAs in four BSF cell lines (427, 90–13, SM-1 and SM-2) relative to those in the 29–13 PCF cell line. Values were normalized to the average of three controls (TERT, PFR2 and actin). Data shown were generated from three biological replicates of each sample with three technical replicates per biological replicate. The gray shaded area represents the range from one log2 increase (2.00) and one log2 decrease (0.50). Error bars indicate standard error of the mean.

