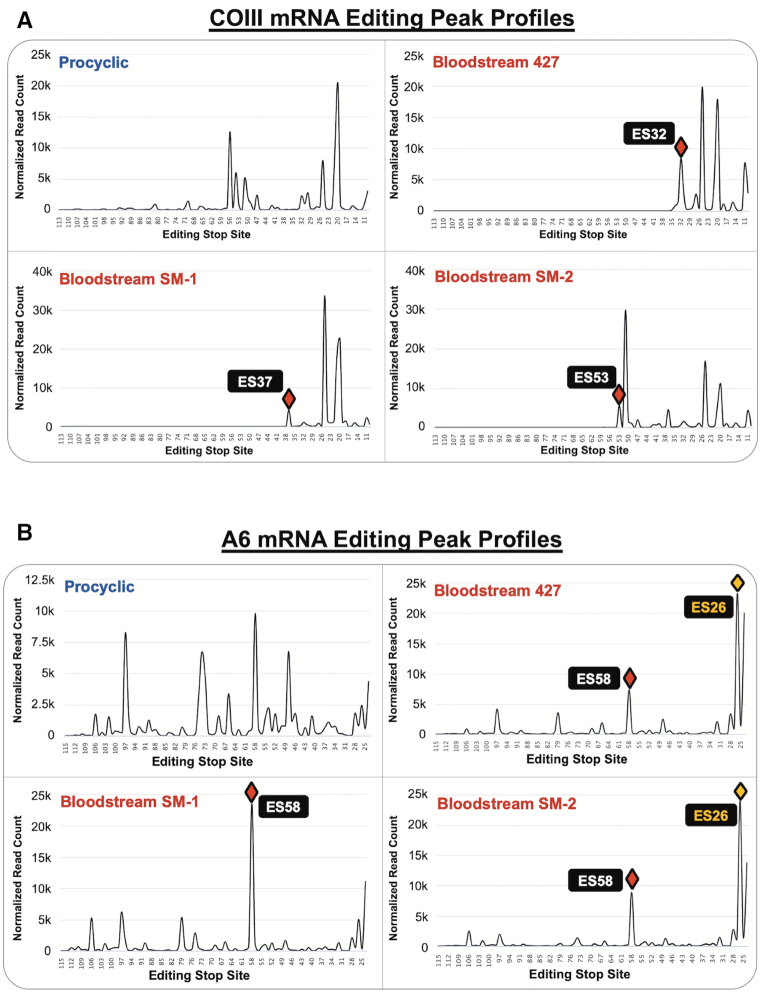
Figure 4.
Editing profiles of COIII and A6 mRNA intermediates organized by editing stop site. Editing peak profiles for PCF 29–13 (upper left), BSF 427 (upper right), BSF SM-1 (lower left), and BSF SM-2 (lower right) for (A) COIII mRNA intermediates and (B) A6 mRNA intermediates. The Y axes represent the number of normalized read counts for mRNAs at each editing stop site (note some differences in scales). Red diamonds indicate the final major peak in COIII mRNA or the most prominent peak in A6 mRNA. The yellow diamonds in (B) indicate peaks at ES26 generated by alternative A6 mRNA editing in BSF 427 and SM-2 at ES27, ES29 and ES33.

