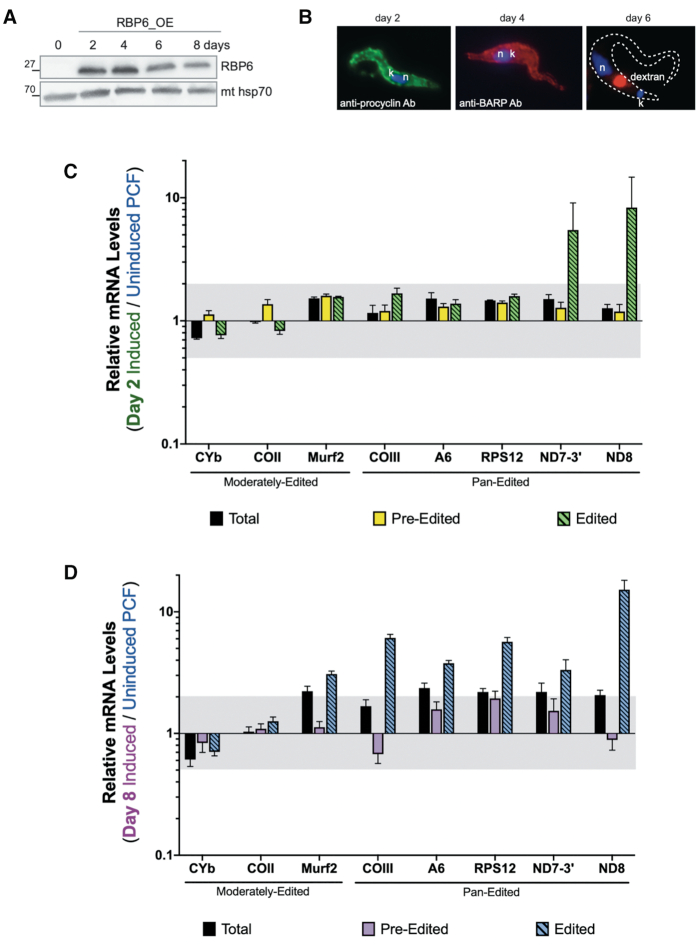
Figure 9.
Quantitative RT-PCR analysis of induced RBP6OE cells compared to uninduced PCF. (A) Western blot analysis of RBP6 levels at 0–8 days post-induction. Mitochondrial (mt) Hsp70 is a loading control. (B) Immunofluorescence of RBP6OE cells on day 2 post-induction (using anti-procyclin antibody), day 4 post-induction (using anti-BARP antibody) and day 6 post-induction (using internalized fluorescently-labeled dextran). DNA was visualized by DAPI staining. (C, D) Relative mRNA levels for total, pre-edited, and edited mitochondrial mRNAs between cells that were induced to ectopically express RBP6 for (C) 2 days to generate an EMF-dominant culture or (D) 8 days to generate a mixed culture of MCF and PCF cells compared to the uninduced PCF cells. Values were normalized to the average of three controls (TERT, PFR2, and actin). Data shown were generated from three biological replicates of each sample with three technical replicates per biological replicate. The gray shaded areas represent the range from one log2 increase (2.00) and one log2 decrease (0.50). Error bars indicate standard error of the mean.

