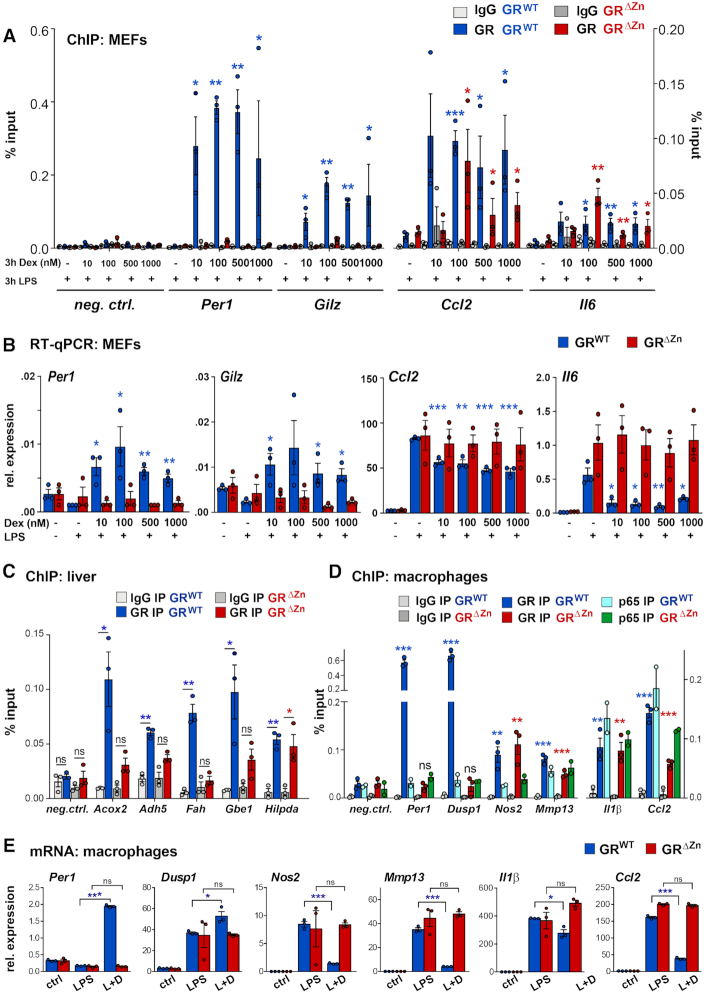
Figure 4.
GR tethering occurs at different ligand concentrations and in various cell types. (A) GR ChIP-qPCR for selected loci in MEFs treated with different concentrations between 10 nM and 1 μM Dex and LPS for 3 h (n = 3), shown as % input with t-test for GR IPs over IgG. (B) qRT-PCR for GR target genes in MEFs treated as in (A) normalized to U36b4, n = 3. t-test for different Dex amounts over LPS only. (A, B) Values are mean ± SEM, ns = not significant, *P< 0.05, **P< 0.01, ***P< 0.001. (C) GR ChIP-qPCR in wild type and homozygous E18.5 livers, n = 3. (D) GR and p65 ChIP-qPCR in fetal macrophages, n = 3 for GR and n = 2 for p65, treated with LPS for 3 h and with Dex overnight. Values in (C) and (D) are shown as %input, mean ± SEM, ns = not significant, *P< 0.05, **P< 0.01, ***P< 0.001. (E) qRT-PCR for GR target genes (normalized to U36b4) in macrophages treated with vehicle, LPS for 6 h or LPS for 6 h and Dex overnight (L + D). Values represent mean ± SEM, n = 3. ns = not significant, *P< 0.05, ***P< 0.001.

