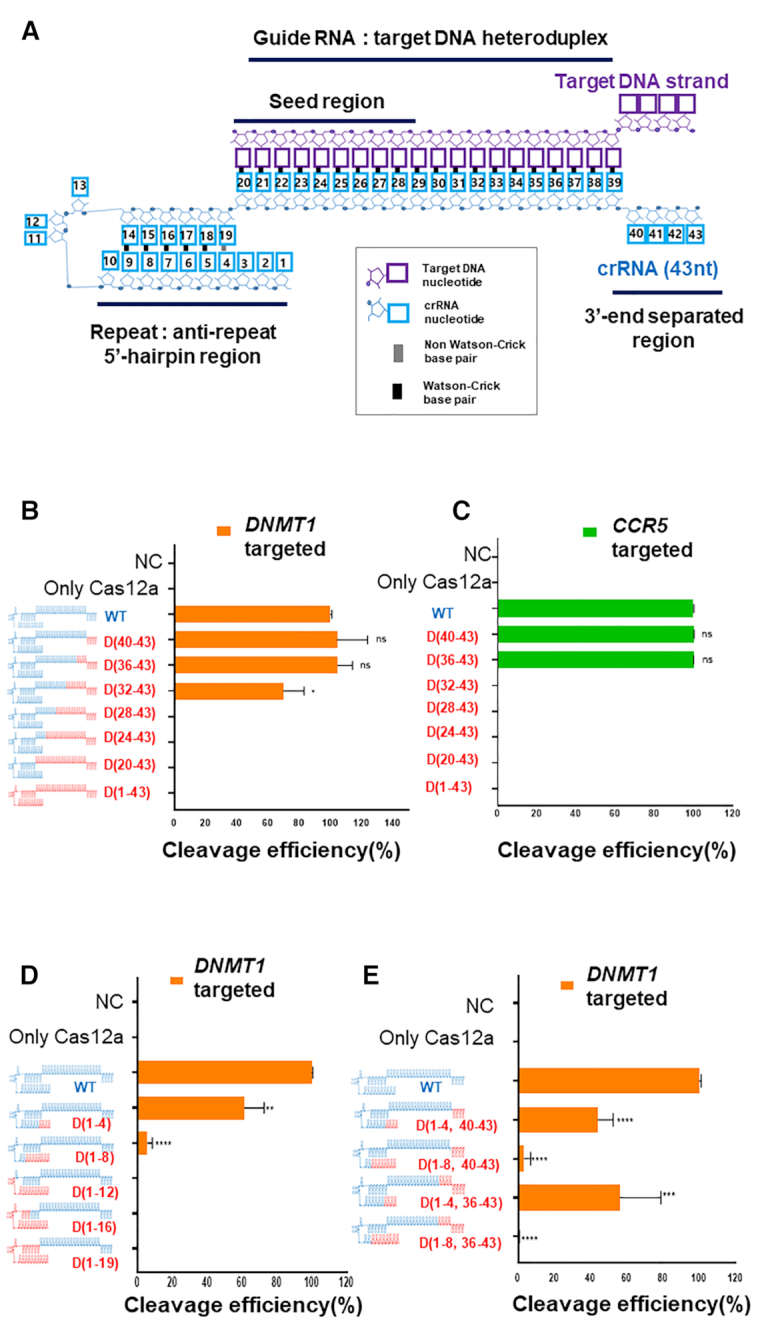
Figure 1.

Target DNA cleavage by CRISPR-Cas12a (Cpf1) using chimeric DNA–RNA guides. (A) Schematic representation of interactions of AsCas12a (cr)RNA (colored in cyon) with target DNA (colored in purple) (6). The AsCas12a (cr)RNA was numbered from 5′-end to 3′-end. (B, C) The target DNA amplicon cleavage efficiency of AsCas12a with partial DNA substitution of (cr)RNA was determined for target sequence in (B) DNMT1 (orange) and (C) CCR5 (green), respectively. The (cr)RNA was replaced with DNA from 3′-end with a 4-nt interval. The RNA portion of the (cr)RNA is shown in blue, and the DNA portion is shown in red ('D' indicates a DNA and the position number of substituted DNA nucleotides in (cr)RNA is indicated). The X-axis indicates the efficiency of the target gene (DNMT1 (orange), CCR5 (green)) cleavage by AsCas12a using various chimeric DNA–RNA guides (DNA substitution of 4-nt from the 3′-end of the (cr)RNA). Y-axis indicates used chimeric (cr)RNAs in the cleavage experiment. (D, E) Target gene (DNMT1) cleavage by AsCas12a using chimeric DNA–RNA guides (Serial 4-nt DNA substitution from the 5′-end of the (cr)RNA, (D)) or chimeric DNA–RNA guides (Combination of DNA substitution in the 5′ or 3′-end of the (cr)RNA, (E)). All cleavage efficiency were calculated from agarose gel separated band intensity (cleaved fragment intensity (%)/total fragment intensity (%)) and normalized to wild-type (cr)RNA (Figure S1). Data are shown as means ± s.e.m. from three independent experiments. P-values are calculated using a two-tailed Student's t-test (ns: not significant, *P< 0.05, **P< 0.01, ***P< 0.001, ****P< 0.0001).
