Figure 2.
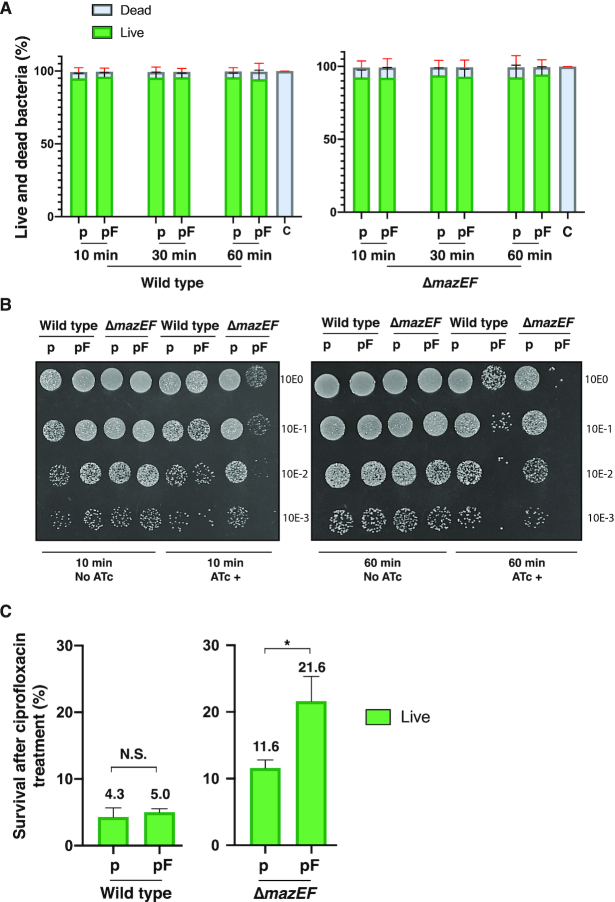
(A) Cell cytometry analysis showing the percentage of live and dead bacteria present after mazF overexpression. S. aureus wild-type and mazEF-deleted strains carrying a control (p) or mazF (pF) plasmid were subject to ATc induction during time. Bacteria were subsequently labeled using RedoxSensorGreen and propidium iodide. Live and dead bacterial counts were determined by fluorescence detection using cell cytometry. Fluorescence detection of heat-killed bacteria was used as a control (c). The percentage of live or dead bacteria from a total of 50 000 bacterial counts is reported. Data is represented as mean ± SD of three independent experiments. (B) Bacterial growth of sorted live bacteria after mazF overexpression. Wild-type and mazEF-deleted strains carrying a control plasmid (p) or a mazF plasmid (pF) were treated or not with ATc. After 10 min (left panel) or 60 min (right panel) of ATc treatment, bacteria were washed, labeled and sorted to obtain 8 × 10⁵ live cells and were serially diluted (top to bottom 100 to 10−3), 10 μl of diluted bacteria were immediately spot-inoculated on Mueller–Hinton agar plates. (C) Wild-type and mazEF-deleted strains carrying a control (p) or a mazF (pF) plasmid were treated with ATc during 10 min. Cell were labeled and sorted and a purified live population of bacteria (8 × 10⁵ cells) was exposed to ciprofloxacin overnight. The remaining bacteria were again labeled, and live cells were counted by cell cytometry. Results are presented as means ± SD of three independent experiments; N.S. is not significant; * P < 0.05 significant differences between the strain carrying the empty (p) or mazF (pF) plasmid.

