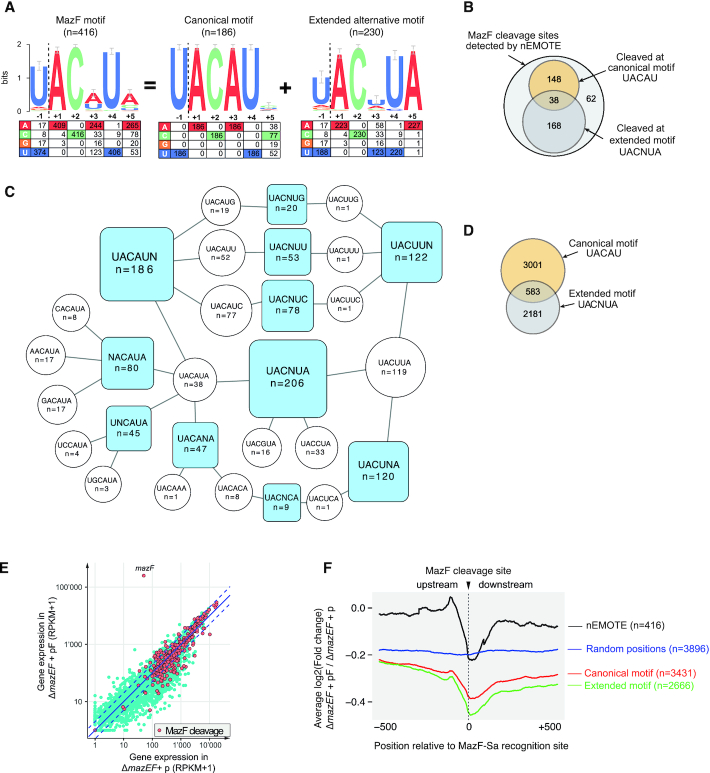
Figure 3.
(A) Logo plot obtained from the alignment of the 416 MazF cleavage sites detected by nEMOTE and the base frequency at each position is indicated in the table below. A logo plot with the strict canonical motif (previously identified) was extracted from the 416 MazF cleavage sites revealing a second extended alternative motif. (B) Venn diagram showing the number of MazF cleavage sites detected by nEMOTE. (C) Diagram showing motifs with a single variable position (blue square) and the cleaved sequences composing each blue motif are shown in white circles. (D) Venn diagram showing the number of predicted canonical and extended alternative MazF recognition sequence along the S. aureus transcriptome based on the nEMOTE results. (E) Overlap of RNA-seq global expression profile (blue dots) of mazEF–deleted strain overexpressing mazF (pF) and control (p) and nEMOTE cleavage sites (orange dots). (F) RNA-seq read coverage profiles 500 bp before and after the nEMOTE-detected sites between mazEF-deleted strain overexpressing or not mazF (log2mazEF-pF/mazEF-p). Profiles obtained around the MazF cleaved sites detected by nEMOTE (black line), around nEMOTE predicted canonical (red line) and alternative extended (green line) sites and around random genome positions (blue line). The y-axis positioning of the curves reflects the average impact of MazF activity on the genes.

