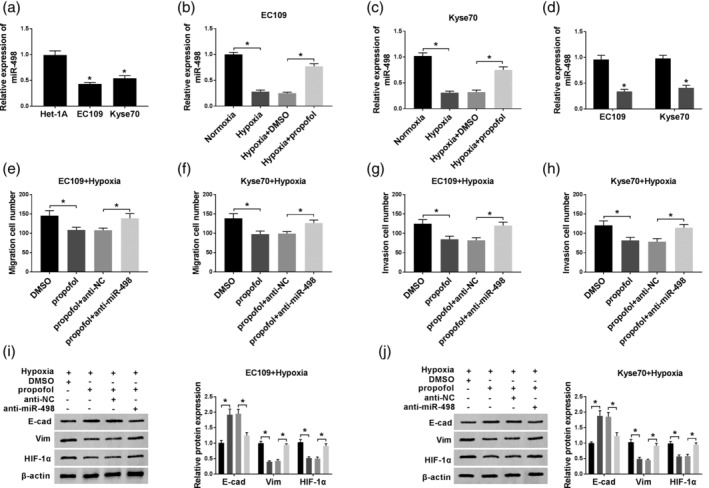
Figure 3.

The function of miR‐498 in propofol‐regulated EC cell progression. (a) The expression of miR‐498 was detected by qRT‐PCR assay in normal and EC cells. (b and c) MiR‐498 expression was determined in EC109 and KYSE70 cells treated with normoxia, hypoxia, hypoxia + DMSO, or hypoxia + propofol, respectively. (d) MiR‐498 expression was measured in EC109 and KYSE70 cells transfected with anti‐NC or anti‐miR‐498.  , anti‐NC;
  , anti‐miR‐498. (e–h) Cell migratory and invasive abilities were explored in hypoxia‐administered EC109 and KYSE70 cells treated with DMSO or propofol and transfected with anti‐NC or anti‐miR‐498. (i and j) Western blot assay was employed to examine the levels of EMT‐markers and HIF‐1α. *P < 0.05. EC109+Hypoxia:
  , DMSO;
  , propofol;
  , propofol+anti‐NC;
  , propofol+anti‐miR‐498; and Kyse70+Hypoxia:
  , DMSO;
  , propofol;
  , propofol+anti‐NC;
  , propofol+anti‐miR‐498.
