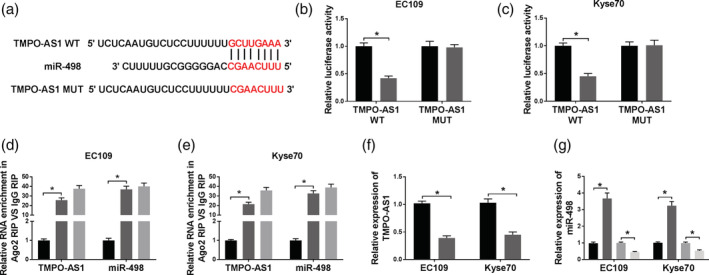
Figure 4.

The interaction between TMPO‐AS1 and miR‐498. (a) The interaction between TMPO‐AS1 and miR‐498 was predicted by starBase. The red color represents the mutated sites. (b and c) The luciferase activity was analyzed in EC109 and KYSE70 cells transfected with TMPO‐AS1 WT or TMPO‐AS1 MUT and miR‐498 or miR‐NC. EC109:  , miR‐NC;
  , miR‐498; and Kyse70:
  , miR‐NC;
  , miR‐498. (d and e) RIP assay was used to verify the interaction between TMPO‐AS1 and miR‐498. EC109:
  , anti‐lgG;
  , anti‐ago2;
  , Input; and Kyse70:
  , anti‐lgG;
  , anti‐ago2;
  , Input. (f) TMPO‐AS1 expression was detected in EC109 and KYSE70 cells transfected with si‐NC or si‐TMPO‐AS1.
  , si‐NC;
  , si‐TMPO‐AS1. (g) MiR‐498 level was investigated in EC109 and KYSE70 cells transfected with si‐NC, si‐TMPO‐AS1, vector, or TMPO‐AS1, respectively. *P < 0.05.
  , si‐NC;
  , si‐TMPO‐AS1;
  , vector;
  , TMPO‐AS1.
