Figure 1.

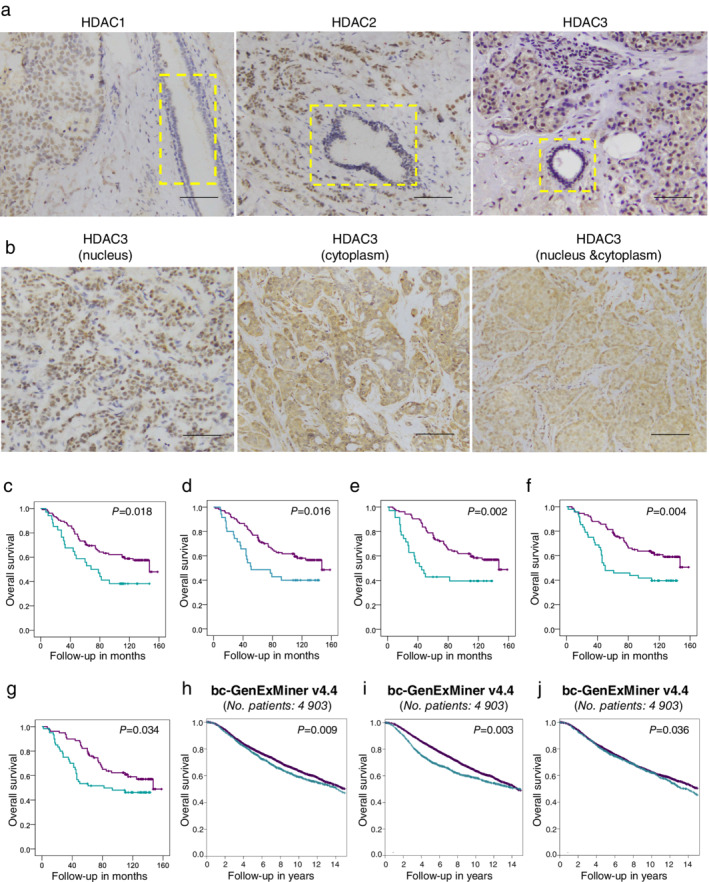
HDAC1, HDAC2, and HDAC3 were upregulated in breast cancer tissues and correlated with worse prognosis in breast cancer patients. (a) Representative immunohistochemical (IHC) staining photos of HDAC1, HDAC2, and HDAC3 in breast specimens. HDAC1, HDAC2, and HDAC3 levels were obviously elevated in the tumor tissues compared to the non‐neoplastic adjacent tissues of patients with invasive ductal carcinoma (IDC). Yellow boxes indicated mammary ducts. Scale bars, 100 μm. (b) Representative IHC photos of three different kinds of HDAC3 subcellular localization. Scale bars, 100 μm. (c–f) Overall survival (OS) curves of 139 IDC patients with different HDAC1 (c) ( ) HDAC1 Low (
 ) HDAC1 High (
 ) HDAC1 low‐censored (
 ) HDAC1 high‐censored, HDAC2 (d) (
 ) HDAC2 Low (
 ) HDAC2 High (
 ) HDAC2 low‐censored (
 ) HDAC2 high‐censored, cytoplasmic HDAC3 (e) (
 ) HDAC3 C‐low (
 ) HDAC3 C‐high (
 ) HDAC3 C‐low‐censored (
 ) HDAC3 C‐high‐censored, and nuclear HDAC3 (f) levels (
 ) HDAC3 N‐low (
 ) HDAC3 N‐high (
 ) HDAC3 N‐low‐censored (
 ) HDAC3 N‐high‐censored. According to another set of criteria in which cases with either high nuclear or cytoplasmic expression were classified into the C‐high/N‐high group and other cases were classified into the Others group, the overall survival curve of the 139 IDC patients was reproduced as Figure 1g (
 ) HDAC3 Others (
 ) HDAC3 C‐high/N‐high (
 ) HDAC3 Others‐censored (
 ) HDAC3 C‐high/N‐high‐censored. P values of the Kaplan‐Meier plots in (c‐g) were calculated by log‐rank test in IBM SPSS Statistics 19 software. (h–j) Kaplan‐Meier survival curves with log‐rank analysis were used to assess the correlation between HDAC1 (h) (
 ) HDAC1 Low (≤ 75th percentile) (
 ) HDAC1 High (> 75th percentile), HDAC2 (i) (
 ) HDAC2 Low (≤ 75th percentile) (
 ) HDAC2 High (> 75th percentile), and HDAC3 (j) (
 ) HDAC3 Low (≤ 80th percentile) (
 ) HDAC3 High (> 80th percentile) expression and overall survival of 4903 breast cancer patients in the bc‐GenExMiner platform (website: http://bcgenex.centregauducheau.fr; all DNA microarray data, node mixed, ER mixed; optimized split for HDAC1 and 2, an 80th percentile customized cutoff for HDAC3).
