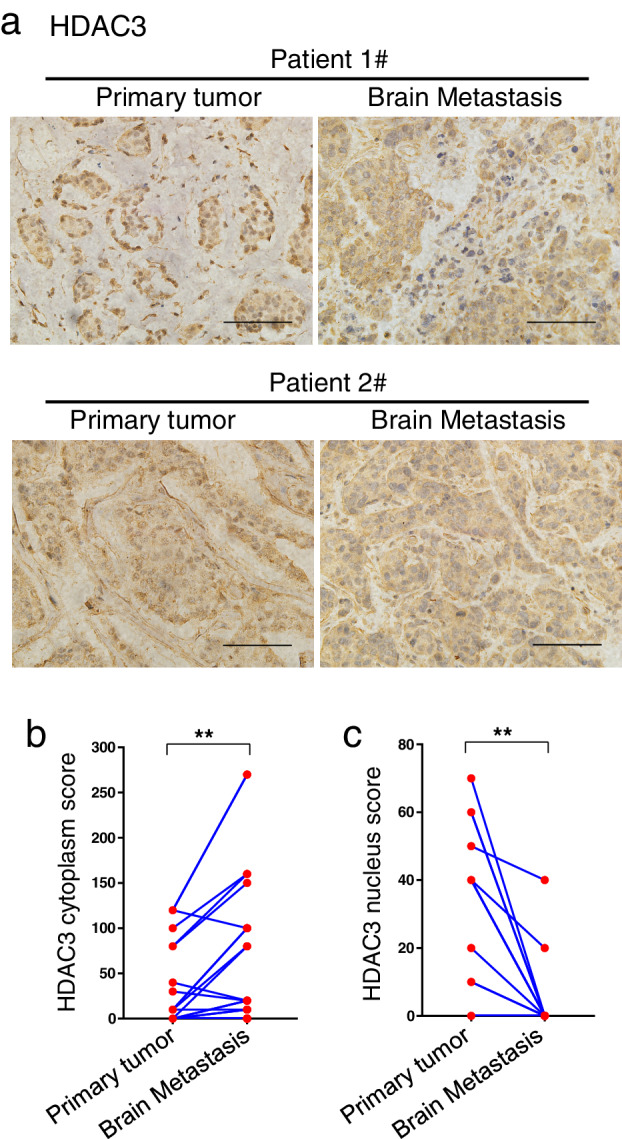
Figure 3.

Cytoplasmic expression of HDAC3 was further upregulated in brain metastasis specimens compared with the matched primary tumor specimens, while nuclear HDAC3 expression was inversely downregulated. (a) Representative immunohistochemical (IHC) staining photos of HDAC3 in primary breast tumor sites and matched brain metastasis specimens were shown. Photos were taken at a magnification of 400×. Scale bars, 100 μm. (b–c) Cytoplasmic HDAC3 (b) and nuclear HDAC3 (c) IHC scores of 24 primary breast tumors and matched brain metastases are shown by symbols and lines plot, and P‐values were calculated by paired t‐tests (scores overlapped in some cases). ** P < 0.01.
