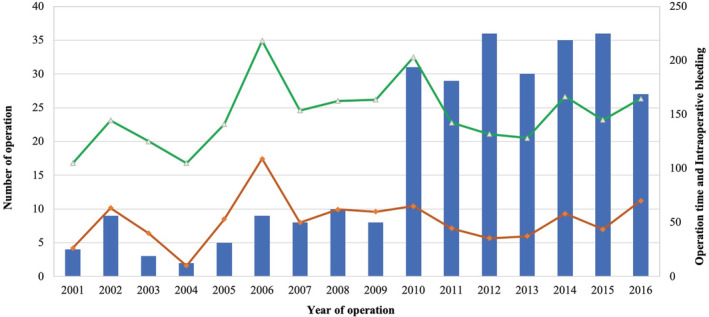
Figure 2.

The number of operations, operative duration and intraoperative bleeding of each year (2001–2016). ( ) Number of operation, (
 ) Intraoperative bleeding (mL), and (
 ) Operation time (minutes).

The number of operations, operative duration and intraoperative bleeding of each year (2001–2016). ( ) Number of operation, (
 ) Intraoperative bleeding (mL), and (
 ) Operation time (minutes).