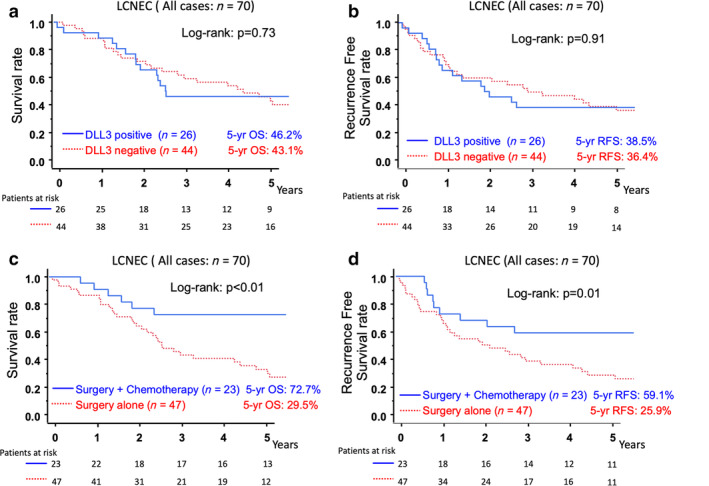
Figure 3.

(a,b). Comparison of the overall survival (OS) (a) and recurrence‐free survival (RFS) (b) between DLL3 expression‐positive and expression‐negative LCNEC patients. (c,d). The comparison of the OS (c) and RFS (d) between LCNEC patients who underwent surgery with and without adjuvant chemotherapy. (a) ( ) DLL3 positive (n = 26) five‐year OS: 46.2%, (
 ) DLL3 negative (n = 44) five‐year OS: 43.1%; (b) (
 ) DLL3 positive (n = 26) five‐year RFS: 38.5%, (
 ) DLL3 negative (n = 44) five‐year RFS: 36.4%; (c) (
 ) Surgery + chemotherapy (n = 23) five‐year OS: 72.7%, (
 ) Surgery alone (n = 47) five‐year RFS: 29.5%; (d) (
 ) Surgery + chemotherapy (n = 23) five‐year RFS: 59.1%, (
 ) Surgery alone (n = 47) five‐year RFS: 29.5%.
