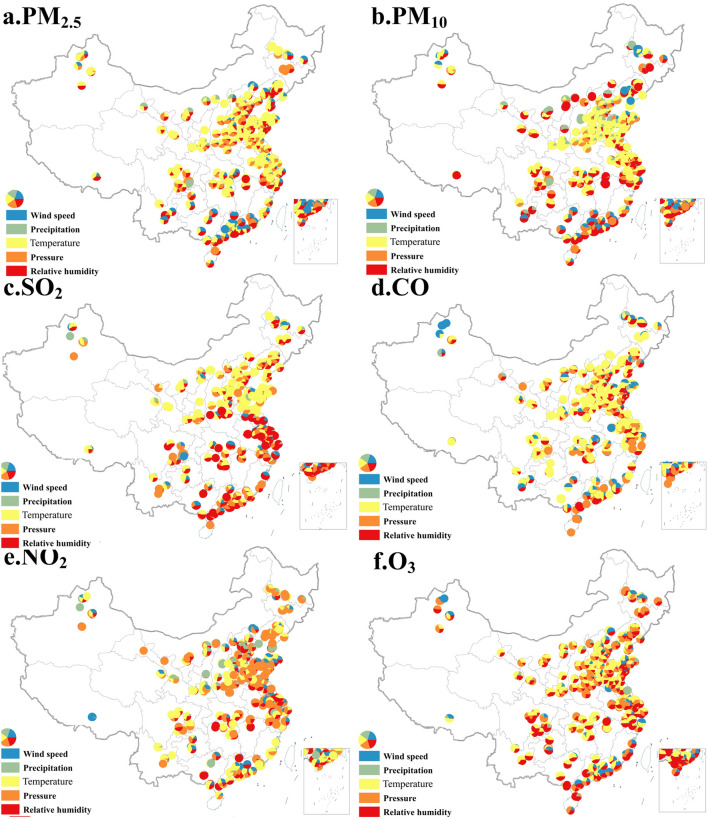
Figure 5.
The estimated results of MLR model for 896 sites in China. (Notes: The map was generated using ESRI’s ArcGIS 10.2 (https://desktop.arcgis.com/en/arcmap); In the MLR model, the independent variables are average wind speed, average temperature, precipitation, relative humidity, and average atmospheric pressure, and the dependent variable is the concentration of six air pollutants. The data used in the model includes the monthly value of pollutant concentration and meteorological elements of 896 stations from June 2014 to February 2019 (57 months in total). The F-test was used to test the significance of the model, and the t-test was used to test the significance of independent variables and R2 to judge the fitting effect of the model. Among the 896 regression models of PM2.5, PM10, SO2, CO, NO2 and O3 concentrations in China, respectively, the significance of the MLR model of 848, 840, 675, 778, 788 and 862 sites passed the F-test and at least one independent variable passed the t-test at the 10% significance level or higher. R2 of the models ranged from 0.19 to 0.93 and its fitting effect was good. The five colors in the pie chart respectively represent the meteorological elements that affect the concentration changes of various pollutants at each station. The marked influencing factors pass the significance level test of at least 10%. The proportion of each color in the pie chart represents the absolute value of the regression coefficient of each meteorological element. The larger the value, the greater the proportion of the corresponding color in the pie chart, indicating the greater the contribution of the meteorological element to the change of pollutant concentration.).

