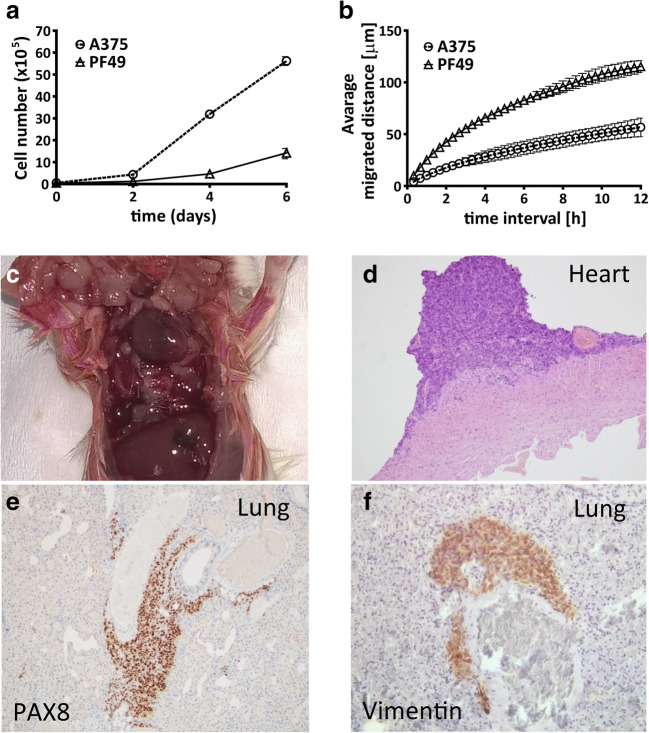
Fig. 2.
Proliferative, migratory and invasive capacity of PF49 cells. a, b Proliferation rate and migratory capacity of PF49 cells were compared with A375 melanoma cells. Cell number was determined after 2, 4 and 6 days. Migrated distance was measured with time-lapse video microscopy for 12 h. c In vivo orthotopic tumorigenicity and invasion was determined in a pleural carcinosis model. Paraffin embedded tumor sections were stained with hematoxylin-eozin d, PAX8 e and vimentin f antibodies. Bars represent means ±SE from two to three independent experiments

