Abstract
Creatinine concentration is one of the important elements in the body for diagnosing kidney failure, muscular dystrophy, glomerular filtration rate, and diabetic nephropathy. The disadvantages of recently introduced analytical techniques, such as Jaffe’s, spectroscopic, colorimetric, and chromatographic methods, for quantifying creatinine in urine involve toxicity, the high cost, interference, and the complexity of the design. In this paper, we designed and fabricated a new colorimetric assay for the measurement of creatinine concentration based on color differentiation generated by mixing different concentrations of creatinine with synthesized silver nanoparticles (AgNPs) coated with polyvinylpyrrolidone (PVP) and polyvinyl alcohol (PVA). An isolated box is designed for the uniform optical imaging of solutions, the captured images are processed in real time, and the quantitative and qualitative results are displayed. For colorimetric processing, a variety of color systems, such as RGB (red, green, blue), CMYK (cyan, magenta, yellow, black), and grayscale (Gr), have been evaluated, indicating that the combination of green (G) and grayscale (Gr) provides the best results for this experiment. TEM analysis and spectroscopy were used to confirm the results of the experiment. Linear range and limit of detection (LOD) were obtained for AgNPs/PVP 0.03–1 mg/dl and 0.024 mg/dl and for AgNPs/PVA 0.01–1 mg/dl and 0.014 mg/dl, respectively, indicating the superiority of our proposed method over recently introduced methods. In this experiment, the detectable resolution with AgNPs/PVP is 40, while it is 71 with AgNPs/PVA. The designed system is simple to use, small in size, and cost-effective for measuring creatinine concentration, while it can be used as a portable system.
Keywords: Biomarker, Biosensor, Nanoparticle, Colorimetric analysis, Optical image processing, Creatinine
Introduction
Creatinine (C4H7N3O) is a waste and non-toxic molecule in the body produced by muscle metabolism in the body. Creatinine concentration is one of the important elements in the body for diagnosing kidney failure, muscular dystrophy, glomerular filtration rate, and diabetic nephropathy (Zinchenko et al. 2012; Gao, Li, and Zhang 2010; Zamora et al. 2007; Kasap et al. 2017). After production, creatinine is transferred to the kidneys and is excreted through the urine without reabsorption in the tubular structures (Jalili and Khataee 2019). Each day, 2% of creatine is converted to creatinine with a constant rate, which is an irreversible and spontaneous conversion. Therefore, the level of creatinine concentration in the body can be measured in blood and urine samples (Iseki et al. 1997; Barr et al. 2004). Under normal conditions, the level of creatinine in the blood serum is between 35 and 140 mMI (Mohammadi and Khayatian 2015). Nowadays, Jaffe's method is routinely used in clinics to determine the level of creatinine. In this method, creatinine reacts in an alkaline medium with picric acid, and the change in the color of the resulting solution (yellow to orange) can be measured by a spectrophotometer (Delanghe and Speeckaert 2011). Interference of picric acid with other biomolecules, such as glucose, urea, uric acid, and ascorbic acid, decreases the sensitivity and selectivity of Jaffe’s method (Du et al. 2016). Moreover, the toxicity of picric acid limits the application of this method in clinical settings. Furthermore, a number of different methods, such as spectroscopic (Krishnegowda et al. 2017), electrochemical (Diouf et al. 2017), colorimetric (Sununta et al. 2018; Du et al. 2015), and chromatography (Zhao 2015), have been developed for determining the concentration of creatinine.
While enzyme-based methods are highly selective and have a good sensitivity, and chromatographic methods provide good accuracy and have less interference (Hewavitharana and Bruce 2003; Mohabbati-Kalejahi et al. 2012; Zakalskiy et al. 2019), these methods often require massive and expensive equipment, various substances to be prepared, skilled personnel, and expensive materials (Mohammadi and Khayatian 2015). Moreover, colorimetric-based methods have a cost advantage and are easy to use; however, these methods face difficulties in terms of quantitative concentration measurements. To overcome this big challenge, plasmatic nanoparticles (gold and silver) have a good potential due to a number of properties, such as cost-effectiveness, high ability for surface reaction, high absorption ability, and large S–V (surface-to-volume) ratio, leading to improved catalytic performance and optical properties (Du et al. 2013; Yadav et al. 2012; Kasap et al. 2017). Furthermore, NPs are also used to enhance the response of enzyme-based and molecular imprinted polymer (MIP)-based biosensors (Nouira et al. 2012; Yadav et al. 2011,2012), as well as to directly determine the creatinine concentration with spectrophotometric and colorimetric methods (He et al. 2015; Mohammadi and Khayatian 2015; Huang et al. 2015). Therefore, it is essential to develop a cheaper, easier, more effective, and more accessible method to determine the concentration of creatinine.
In this study, we introduce a simple, cheaper, portable, and more efficient method for determining creatinine levels based on synthesized nanoparticles and colorimetric image-processing techniques. For this purpose, PVP-coated silver nanoparticles (AgNPs@PVP) and PVA-coated silver nanoparticles (AgNPs@PVA) were synthesized. Different concentrations of creatinine will create color differentiation when mixed with the synthesized solution. The color changes, as an indicator for creatinine levels, were measured from images captured in a designed isolated box with a uniformly illuminated imaging environment. The captured images were processed in real time by MATLAB software application, and the results compared with those of the spectroscopic-based method.
Material and methods
Materials
All chemicals and solvents used in this experiment were of an analytical grade and of highest purity, and they were used as received without additional purification. Moreover, double- distilled and deionized water was used to prepare the solutions in the experiments to prevent possible interference. Creatinine (≥ 99%), polyvinylpyrrolidone (PVP), polyvinyl alcohol (PVA) 72,000, silver nitrate (AgNO3, ≥ 99.0%), and tri-sodium citrate dehydrate (≥ 99.0%) were purchased from MERCK Company (https://www.merck.com). The glassware used was thoroughly washed with aqua regia, then rinsed thoroughly with deionized water, and finally air-dried prior to use.
Instrumentation
Ultraviolet visible spectrometer was used to measure and record the absorption spectra in the samples. To obtain the size and aggregation of the nanoparticles, we used a transmission electron microscope (TEM ZEISS EM900) at the Molecular Medicine Research Center (Tabriz University of Medical Sciences, Tabriz, Iran). We also used an imaging isolation box developed by the authors to measure the color changes in the samples.
Synthesis of silver nanoparticles with PVP
To synthesize silver nanoparticles with PVP, we used sodium borohydride, NaBH4, as the reducing agent and PVP as the stabilizing agent (Van Dong et al. 2012; Parmar et al. 2016). For this purpose, 3 mg of NaBH4 powder was dissolved in 45 ml of deionized water and then poured into a glass conical flask. Afterward, it was put in an ice bath and stirred for 25 min. Thereafter, 6 ml of 3 mM AgNO3 aqueous solution was added slowly to the solution with gentle mixing. Immediately after, 3 ml of 1%w/v PVP solution was added to the solution and stirring was stopped. The color of the obtained solution is yellow. This solution is kept in an amber glass bottle.
Because the concentration of nanoparticles affects the colorimetric results, the values obtained from the experiments should not be increased or decreased. To ensure a complete reaction and the removal of excess particles, we use more reducing agent than silver nitrate so that silver nitrate is completely converted into silver nanoparticles, and this is in fact our limiting reactor. Also, to remove excess nanoparticles, after synthesis, the solution is centrifuged and the excess amount separated from the main solution.
Synthesis of silver nanoparticles with PVA
This synthesis is similar to the previous one, except that PVA is used here instead of PVP. For this purpose, 45 ml of 1.8 mM aqueous solution of NaBH4 was poured into a glass conical flask and then placed in an ice bath on stirrer for 25 min. Then, 6 ml of 2 mM AgNO3 solution was slowly added. Afterward, 3 ml of 2% PVA solution was added. The obtained light yellow solution was kept in an amber glass bottle until use.
Sample preparation and general procedures
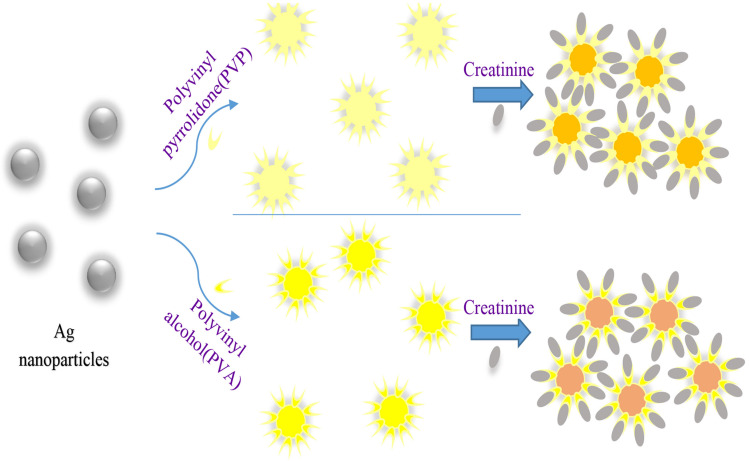
In Blackburn et al. (Alula et al. 2018) and Blackburn et al. (Parmar et al. 2016), it was found that adding creatinine to silver nanoparticles caused aggregation and discoloration in the solution. We used these findings to measure the creatinine concentration by image processing in real time. Polyvinyl pyrrolidone (PVP) is also used as a reducing, stabilizing, dispersing,and shape controlling agent in the synthesis of silver nanoparticles (Wang et al. 2005; Koczkur et al. 2015). The mechanisms of polyvinyl pyrrolidone in the preparation process were discussed through the optical characteristics of the reaction system (Wang et al. 2005). PVP attached to the silver and protected the Ag particles from agglomerating and growing. Moreover, polyvinyl alcohol (PVA) with the chemical formula of (C2H4O)x, a water-soluble synthetic polymer, is a reducing agent for silver nanoparticles. The solution synthesized in reaction with creatinine causes discoloration in the sample (Fig. 1) (Lad 2012).
Fig. 1.
Schematics of process of AgNPs/PVP and AgNPs/PVa with the creatinine and the color change obtained in the interaction with AgNPs
To perform the experiment, we created different creatinine concentrations using creatinine powder (0–100 mg/dl). When testing silver nanoparticles coated with PVP, the solution pH was adjusted to 6.5 (using NaOH). Then, 200 µl of different concentrations of creatinine was added to 1 ml of the solution (at 27 °c). After 30 min, the color of the solution stabilized, and image processing and spectrophotometric tests were performed on the samples. Moreover, for testing silver nanoparticles coated with PVA, the pH of the solution was first adjusted to 7.5. Afterward, we mixed 400 µl of different concentrations of creatinine with 1 ml of the solution at 35° C. After 20 min, the color of the solution stabilized, and image processing and spectrophotometric tests were performed on the samples.
Results
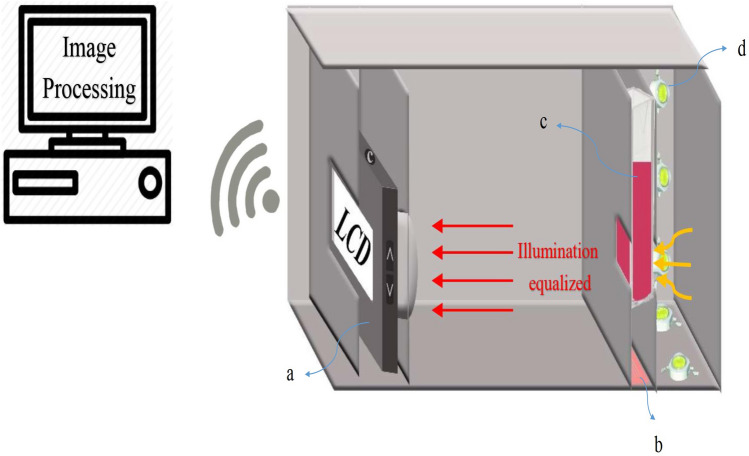
The imaging box was designed to isolate the ambient light, fix the light and temperature inside the box, and to generally obtain an accurate measurement of the creatinine concentration. After preparation, imaging of the samples was performed using a cuvette placed in the box, and then the images were sent to the system in real time for processing. In this method, the processing is based on the color changes in the samples caused by different concentrations of creatinine. Figure 2 depicts the schematic diagram of the proposed imaging system. For comparison, spectroscopy of the samples was simultaneously performed using a spectroscope.
Fig. 2.
Colorimetric optical image-processing box components: a: Camera, b: thermal element and temperature control module. c: Sample cuvette. d: Power LED. The illumination equalized in the box reaches the imaging device after passing through the sample. The captured image is transferred to the real-time processing system and the results are displayed
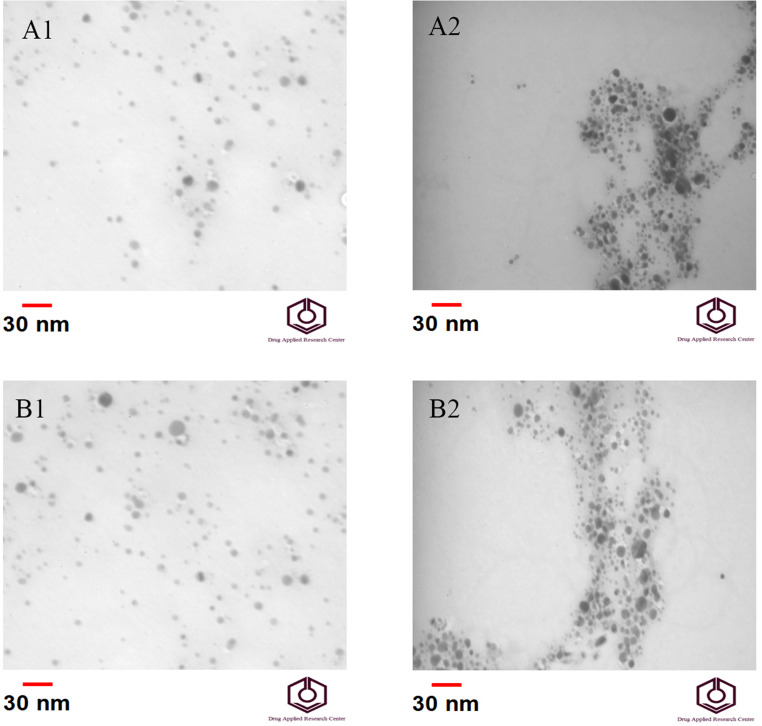
Moreover, TEM analysis is also used to confirm the results of the experiment. TEM imaging was used to capture fine details—even as small as a single column of atoms, which is thousands of times smaller than a resolvable object seen in a light microscope (Fig. 3). The TEM imaging results indicated that adding creatinine to both samples containing silver nanoparticles with PVP and PVA resulted in the aggregation of the particles and discoloration in the solution.
Fig. 3.
TEM images from the samples; a1 AgNPs/PVP in the absence of creatinine; a2 AgNPs/PVP in the presence of creatinine; b1 AgNPs/PVA in the absence of creatinine; b2 AgNPs/PVA in the presence of creatinine; scale bar: 30 nm. According to the figure, after adding creatinine to the solution containing nanoparticles, it causes aggregation and discoloration in the solution
To measure creatinine concentration, solutions with different concentrations of creatinine were prepared and then tested to obtain a linear range with the best regression coefficient.
Then, ten different creatinine concentrations in the obtained linear range were tested to appraise the evaluation indices [such as limit of detection (LOD), standard deviation (SD), and relative standard deviation (RSD)]. It is important to note that in each experiment, three samples with three different creatinine concentrations were selected and tested seven times to calculate the LOD.
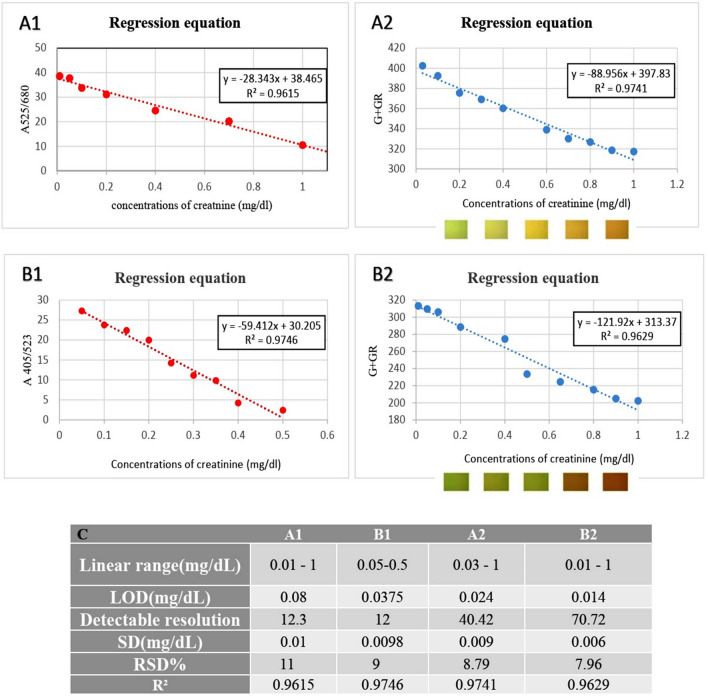
As shown in Fig. 4, the linear range and limit of detection (LOD) were obtained for AgNPs/PVP as 0.03–1 mg/dl and 0.024 mg/dl and for AgNPs/PVA as 0.01–1 mg/dl and 0.014 mg/dl, respectively. The detectable resolution with AgNPs/PVP is 40 and with AgNPs/PVA is 71 for measuring creatinine concentrations. Detectable resolution is the result of linear range’s division by LOD. This index indicates the number of measurable points in each method. The colorimetric-based method proposed by Sergeyeva et al. (Sergeyeva et al. 2013) has a limit of detection of 2.83 mg/dl and a linear range of 2.83–28.3. Moreover, the detectable resolution of this method is 9. In addition, the linear range and LOD for the proposed method based on the Jaffé reaction combined with microfluidics technology introduced by Tseng (Tseng et al. 2018) were 0.19–7.64 mg/dl and 0.19 mg/dl, respectively. Furthermore, and the detectable resolution for this method was 37, indicating the superiority of the proposed method.
Fig. 4.
Regression equations for a1 spectroscopic analysis (A525/680) of AgNPs/PVP/creatinine; a2 colorimetric (image processing) of AgNPs/PVP/creatinine; b1 spectroscopic analysis (A405/523) of AgNPs/PVA/creatinine; b2 colorimetric of AgNPs/PVA/creatinine. c Results obtained from data analysis. << G = green Gr = grayscale >> // << A 405/523 = absorption ratio at 405–523>>
Discussion
Recently, the colorimetric method with image-processing technique has been used to measure the concentration of various compounds present in the human body. Therefore, the color changes in solutions containing AgNPs@PVP and AgNPs@PVA caused by different concentrations of creatinine are discussed in the current study. In this study, this color change is measured using a designed optical imaging and image-processing system (colorimetric), and the amount of creatinine (quantitatively and qualitatively) is displayed in real time. For colorimetric processing, a variety of color systems, such as RGB (red, green, blue), CMYK (cyan, magenta, yellow, black), and grayscale (Gr), have been evaluated, indicating that the combination of green (G) and grayscale (Gr) provides the best results in this experiment. Possible noise in images is also eliminated by the software.
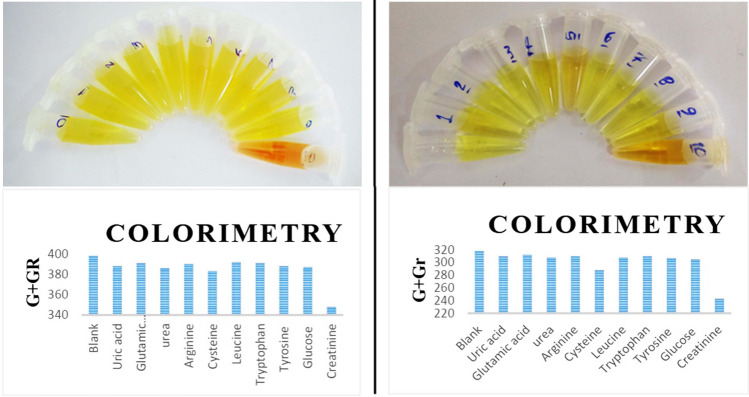
To compare selectivity, an experiment was performed using a number of compounds in blood and urine (interfering compounds). Solutions containing uric acid, glutamic acid, urea, arginine, cysteine, leucine, tryptophan, tyrosine, and glucose were used for this experiment. The results of this experiment are shown in Fig. 5. As can be observed, changes in color in different solutions in the presence of creatinine are negligible.
Fig. 5.
Colorimetric testing for system selectivity in the presence of interfering compounds; left: for AgNPs/PVP; right: for AgNPs/PVA; In the presence of 50 μM of each compound. The presence of creatinine in the solution, causing discoloration and decrease the amount of G + Gr
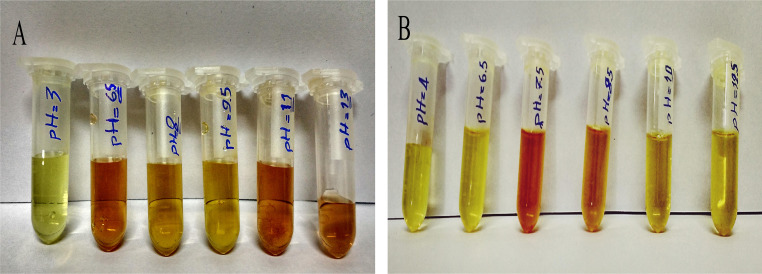
To analyze pH sensitivity, different pH ranges were created for each sample. Sodium hydroxide (NaOH) and hydrogen chloride (HCl) were used to adjust the pH of the solution. As shown in Fig. 6, the optimized pH for AgNPs@PVP is 6.5, while it is 7.5 for AgNPs@PVA.
Fig. 6.
PH sensitivity results for a AgNPs/PVP/creatinine and b AgNPs/PVA/creatinine. In a the solution (NPs) aggregates for pH greater than 10, before adding creatinine. In other pH except 6.5 for AgNPs@PVP and 7.5 for AgNPs@PVA), the effect of adding creatinine to the sample is negligible
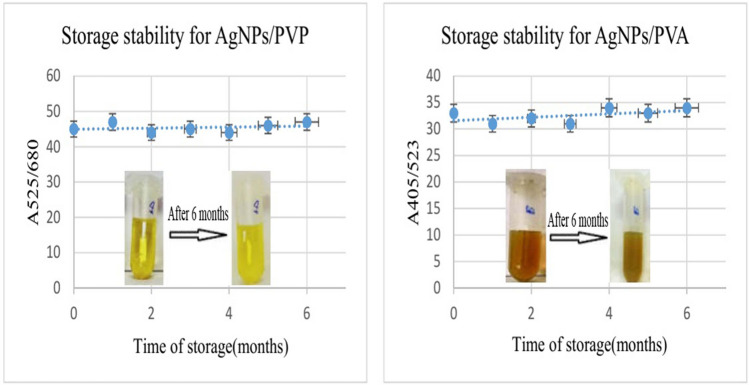
Moreover, the synthesized AgNPs@PVP and AgNPs@PVA nanoparticles are stable for more than 6 months. To demonstrate the stability of the synthesized nanoparticles, we prepared images and spectra of nanoparticles during a 6-month period. It should be noted that the synthesized samples were kept in an amber glass bottle at a temperature of 4 °C during this period. Figure 7 shows the results with regard to storage stability.
Fig. 7.
Storage stability of the synthesized nanoparticles: left:AgNPs/PVP; right:AgNPs/PVA. The synthesized samples were kept in an amber glass bottle at a temperature of 4° C during this period
A table was compiled to compare the proposed method with other similar methods. As can be seen, this method, while simple, provides acceptable and reliable results for measuring creatinine levels. The results of this comparison are presented in Table 1.
Table 1.
Comparison of measurement indices and parameters of different methods with the presented method
| References | Method | Linear range | LOD | Detectable resolution | Accuracya, % | SD, (mg/dl) | RSD, % | R2 | Storage stability | |
|---|---|---|---|---|---|---|---|---|---|---|
| Sergeyeva et al. (2013) | MIP | 2.83–28.3 mg/dl | 2.83 mg/dl | 10 | – | – | – | – | 1 year | |
| Du et al. (2016) | UV−vis spectrometer | 2.26–15.83 μg/dl | 0.15 μg/dl | 90 | – | – | 8 | 0.994 | – | |
| Alula et al. (2018) | Colorimetric | 0–47.5 μg/dl | 0.8 μg/dl | 59 | – | – | – | 0.996 | – | |
| Tseng et al. (2018) | Microfluidic paper-based platform | 0.19–7.64 mg/dl | 0.19 mg/dl | 39 | – | – | – | 0.99 | 100 days | |
| Sittiwong and Unob (2015) | Spectrophotometer | 1.5–4 mg/dl | 1.37 mg/dl | 3 | – | 1.37 | 9.7 | 0.95 | – | |
| This work | Colorimetric optical image processing | AgNPs/PVP | 0.03–1 mg/dl | 0.024 mg/dl | 40 | 4.6 | 0.009 | 8.79 | 0.9741 | 6 month |
| AgNPs/PVA | 0.01–1 mg/dl | 0.014 mg/dl | 71 | 3 | 0.006 | 7.96 | 0.9629 | 6 month | ||
aAccuracy% = (actual value-measured value)/(actual value) × 100; the measured values are reported on average
In terms of complexity and expensive instruments, this method is simple to use and requires no special training. Moreover, the cost of testing is much lower than that of other creatinine measurement methods (e.g., spectroscopy, chromatography, enzymatic, and so on). In addition, the proposed device can be used as a portable one.
Abbreviations
- AgNPs
Silver nanoparticles
- LOD
Limit of detection
- TEM
Transmission electron microscope
- PVP
Polyvinyl pyrrolidone
- PVA
Polyvinyl alcohol
- MIP
Molecular imprinted polymer
- SD
Standard deviation
- RSD
Relative standard deviation
Author contributions
HTK and ME conceived of the presented idea and designed the study. RN and MA carried out the experiments. SHR implemented the proposed optical imaging system. All authors discussed the results and contributed to the final manuscript.
Funding
This study is supported by Biotechnology Research Center, Tabriz University of Medical Sciences (Grant No. 60943).
Availability of data and material
Data will be made available on request.
Compliance with ethical standards
Conflict of interest
We the undersigned declare that this manuscript is original, has not been published before and is not currently being considered for publication elsewhere. We confirm that the manuscript has been read and approved by all named authors and that there are no other persons who satisfied the criteria for authorship but are not listed.
Ethical statement
This work is partially supported by vice-chancellery for research and technology of Tabriz University of Medical Sciences under Grant No. 60943 and Ethical Code No. IR.TBZMED.REC.1398.072. The funders had no role in study design, data collection and analysis, decision to publish, or preparation of the manuscript.
Contributor Information
Ramin Narimani, Email: narimani.ramin@yahoo.com.
Mehdi Azizi, Email: mehdi.azizi6815@gmail.com.
Mahdad Esmaeili, Email: mh.esmaeili.md@gmail.com, Email: esmailim@tbzmed.ac.ir.
Seyed Hossein Rasta, Email: s.h.rasta@abdn.ac.uk.
Hamid Tayebi Khosroshahi, Email: drtayebikh@yahoo.com, https://scholar.google.com/citations?user=B3a8H7wAAAAJ&hl=en.
References
- Alula MT, Karamchand L, Hendricks NR, Blackburn JM. Citrate-capped silver nanoparticles as a probe for sensitive and selective colorimetric and spectrophotometric sensing of creatinine in human urine. Anal Chim Acta. 2018;1007:40–49. doi: 10.1016/j.aca.2017.12.016. [DOI] [PubMed] [Google Scholar]
- Barr DB, Wilder LC, Caudill SP, Gonzalez AJ, Needham LL, Pirkle JL. Urinary creatinine concentrations in the US population: implications for urinary biologic monitoring measurements. Environ Health Perspect. 2004;113:192–200. doi: 10.1289/ehp.7337. [DOI] [PMC free article] [PubMed] [Google Scholar]
- Delanghe JR, Speeckaert MM. Creatinine determination according to Jaffe—what does it stand for? Nephrol Dial Transplant Plus. 2011;4:83–86. doi: 10.1093/ndtplus/sfq211. [DOI] [PMC free article] [PubMed] [Google Scholar]
- Diouf A, Motia S, El Alami El N, Hassani NE, Bari, and B Bouchikhi. Development and characterization of an electrochemical biosensor for creatinine detection in human urine based on functional molecularly imprinted polymer. J Electroanal Chem. 2017;788:44–53. doi: 10.1016/j.jelechem.2017.01.068. [DOI] [Google Scholar]
- Du J, Zhu B, Chen X. Urine for plasmonic nanoparticle-based colorimetric detection of mercury ion. Small. 2013;9:4104–4111. doi: 10.1002/smll.201300593. [DOI] [PubMed] [Google Scholar]
- Du J, Zhu B, Leow WR, Chen S, Sum TC, Peng X, Chen X. Colorimetric detection of creatinine based on plasmonic nanoparticles via synergistic coordination chemistry. Small. 2015;11:4104–4110. doi: 10.1002/smll.201403369. [DOI] [PubMed] [Google Scholar]
- Du H, Chen R, Jianjun Du, Fan J, Peng X. Gold nanoparticle-based colorimetric recognition of creatinine with good selectivity and sensitivity. Ind Eng Chem Res. 2016;55:12334–12340. doi: 10.1021/acs.iecr.6b03433. [DOI] [Google Scholar]
- Gao B, Li Y, Zhang Z. Preparation and recognition performance of creatinine-imprinted material prepared with novel surface-imprinting technique. J Chromatogr B. 2010;878:2077–2086. doi: 10.1016/j.jchromb.2010.06.007. [DOI] [PubMed] [Google Scholar]
- He Yi, Zhang X, Haili Yu. Gold nanoparticles-based colorimetric and visual creatinine assay. Microchim Acta. 2015;182:2037–2043. doi: 10.1007/s00604-015-1546-0. [DOI] [Google Scholar]
- Hewavitharana AK, Bruce HL. Simultaneous determination of creatinine and pseudouridine concentrations in bovine plasma by reversed-phase liquid chromatography with photodiode array detection. J Chromatogr B. 2003;784:275–281. doi: 10.1016/S1570-0232(02)00799-7. [DOI] [PubMed] [Google Scholar]
- Huang X, Li Y, Pan J, Fushen Lu, Chen Y, Gao W. Glutathione-protected hierarchical colorimetric response of gold nanoparticles: a simple assay for creatinine rapid detection by resonance light scattering technique. Plasmonics. 2015;10:1107–1114. doi: 10.1007/s11468-015-9907-4. [DOI] [Google Scholar]
- Iseki K, Ikemiya Y, Fukiyama K. Risk factors of end-stage renal disease and serum creatinine in a community-based mass screening. Kidney Int. 1997;51:850–854. doi: 10.1038/ki.1997.119. [DOI] [PubMed] [Google Scholar]
- Jalili R, Khataee A. Aluminum (III) triggered aggregation-induced emission of glutathione-capped copper nanoclusters as a fluorescent probe for creatinine. Microchim Acta. 2019;186:29. doi: 10.1007/s00604-018-3111-0. [DOI] [PubMed] [Google Scholar]
- Kasap BO, Marchenko SV, Soldatkin OO, Dzyadevych SV, Kurc BA. Biosensors based on nano-gold/zeolite-modified Ion selective field-effect transistors for creatinine detection. Nanoscale Res Lett. 2017;12:162. doi: 10.1186/s11671-017-1943-x. [DOI] [PMC free article] [PubMed] [Google Scholar]
- Koczkur KM, Mourdikoudis S, Polavarapu L, Skrabalak SE. Polyvinylpyrrolidone (PVP) in nanoparticle synthesis. Dalton Trans. 2015;44:17883–17905. doi: 10.1039/C5DT02964C. [DOI] [PubMed] [Google Scholar]
- Krishnegowda A, Padmarajaiah N, Anantharaman S, Honnur K. Spectrophotometric assay of creatinine in human serum sample. Arab J Chem. 2017;10:S2018–S2024. doi: 10.1016/j.arabjc.2013.07.030. [DOI] [Google Scholar]
- Lad U. Electrochemical enzyme electrodes for glucose and creatinine. Leeds: University of Leeds; 2012. [Google Scholar]
- Mohabbati-Kalejahi E, Azimirad V, Bahrami M, Ganbari A. A review on creatinine measurement techniques. Talanta. 2012;97:1–8. doi: 10.1016/j.talanta.2012.04.005. [DOI] [PubMed] [Google Scholar]
- Mohammadi S, Khayatian G. Highly selective and sensitive photometric creatinine assay using silver nanoparticles. Microchim Acta. 2015;182:1379–1386. doi: 10.1007/s00604-015-1460-5. [DOI] [Google Scholar]
- Nouira W, Maaref A, Francis Vocanson M, Siadat JS, Lagarde F, Jaffrezic-Renault N. Enhancement of enzymatic IDE biosensor response using gold nanoparticles. Example of the detection of urea. Electroanalysis. 2012;24:1088–1094. doi: 10.1002/elan.201100681. [DOI] [Google Scholar]
- Parmar AK, Valand NN, Solanki KB, Menon SK. Picric acid capped silver nanoparticles as a probe for colorimetric sensing of creatinine in human blood and cerebrospinal fluid samples. Analyst. 2016;141:1488–1498. doi: 10.1039/C5AN02303C. [DOI] [PubMed] [Google Scholar]
- Sergeyeva TA, Gorbach LA, Piletska EV, Piletsky SA, Brovko OO, Honcharova LA, Lutsyk OD, Sergeeva LM, Zinchenko OA, El'skaya AV. Colorimetric test-systems for creatinine detection based on composite molecularly imprinted polymer membranes. Anal Chim Acta. 2013;770:161–168. doi: 10.1016/j.aca.2013.01.048. [DOI] [PubMed] [Google Scholar]
- Sittiwong J, Unob F. Detection of urinary creatinine using gold nanoparticles after solid phase extraction. Spectrochim Acta Part A Mol Biomol Spectrosc. 2015;138:381–386. doi: 10.1016/j.saa.2014.11.080. [DOI] [PubMed] [Google Scholar]
- Sununta S, Rattanarat P, Orawon CHAILAPAKUL, Praphairaksit N. Microfluidic paper-based analytical devices for determination of creatinine in urine samples. Anal Sci. 2018;34:109–113. doi: 10.2116/analsci.34.109. [DOI] [PubMed] [Google Scholar]
- Tseng C-C, Yang R-J, Wei-Jhong Ju, Lung-Ming Fu. Microfluidic paper-based platform for whole blood creatinine detection. Chem Eng J. 2018;348:117–124. doi: 10.1016/j.cej.2018.04.191. [DOI] [Google Scholar]
- Van Dong P, Ha CH, Kasbohm J. Chemical synthesis and antibacterial activity of novel-shaped silver nanoparticles. Int Nano Lett. 2012;2:9. doi: 10.1186/2228-5326-2-9. [DOI] [Google Scholar]
- Wang H, Qiao X, Chen J, Wang X, Ding S. Mechanisms of PVP in the preparation of silver nanoparticles. Mater Chem Phys. 2005;94:449–453. doi: 10.1016/j.matchemphys.2005.05.005. [DOI] [Google Scholar]
- Yadav S, Kumar A, Pundir CS. Amperometric creatinine biosensor based on covalently coimmobilized enzymes onto carboxylated multiwalled carbon nanotubes/polyaniline composite film. Anal Biochem. 2011;419:277–283. doi: 10.1016/j.ab.2011.07.032. [DOI] [PubMed] [Google Scholar]
- Yadav S, Devi R, Bhar P, Singhla S, Pundir CS. Immobilization of creatininase, creatinase and sarcosine oxidase on iron oxide nanoparticles/chitosan-g-polyaniline modified Pt electrode for detection of creatinine. Enzyme Microbial Technol. 2012;50:247–254. doi: 10.1016/j.enzmictec.2012.01.008. [DOI] [PubMed] [Google Scholar]
- Zakalskiy A, Stasyuk N, Gonchar M. Creatinine deiminase: characterization, using in enzymatic creatinine assay, and production of the enzyme. Curr Protein Pept Sci. 2019;20:465–470. doi: 10.2174/1389203720666181114111731. [DOI] [PubMed] [Google Scholar]
- Zamora E, Lupón J, Urrutia A, González B, Mas D, Díez C, Altimir S, Valle V. Prognostic significance of creatinine clearance rate in patients with heart failure and normal serum creatinine. Rev Esp Cardiol. 2007;60:1315–1318. doi: 10.1157/13113938. [DOI] [PubMed] [Google Scholar]
- Zhao J. Simultaneous determination of plasma creatinine, uric acid, kynurenine and tryptophan by high-performance liquid chromatography: method validation and in application to the assessment of renal function. Biomed Chromatogr. 2015;29:410–415. doi: 10.1002/bmc.3291. [DOI] [PubMed] [Google Scholar]
- Zinchenko OA, Marchenko SV, Sergeyeva TA, Kukla AL, Pavlyuchenko AS, Krasyuk EK, Soldatkin AP, El'skaya AV. Application of creatinine-sensitive biosensor for hemodialysis control. Biosens Bioelectron. 2012;35:466–469. doi: 10.1016/j.bios.2012.02.062. [DOI] [PubMed] [Google Scholar]
Associated Data
This section collects any data citations, data availability statements, or supplementary materials included in this article.
Data Availability Statement
Data will be made available on request.


