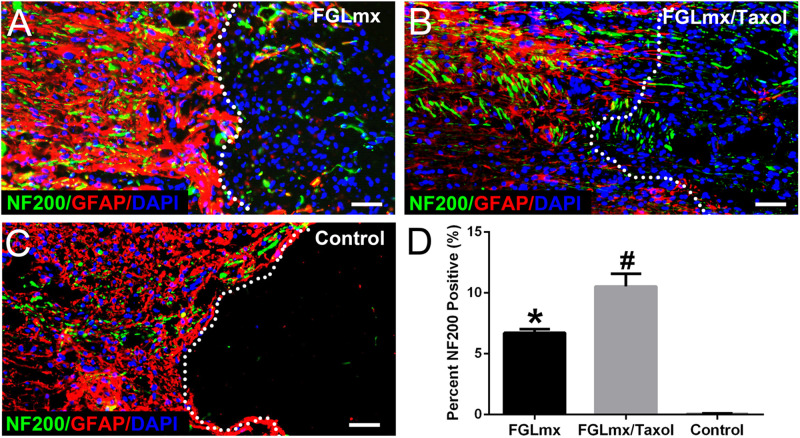
FIGURE 5.
Presence of neurites (green) extending beyond the lesion border in longitudinal sections containing the lesion epicenter: GFAP (red), NF200 (green), and DAPI (blue). Animals were treated with FGLmx (A), FGLmx/Taxol (B), and 5% glucose as the control (C). The white dotted line indicates the lesion border. The scale bar represents 50 μm. (D) Quantification of neurites extending beyond the lesion border (± SEM). #P < 0.05 compared with the other two groups; *P < 0.05 compared with the control group.

