FIGURE 6.
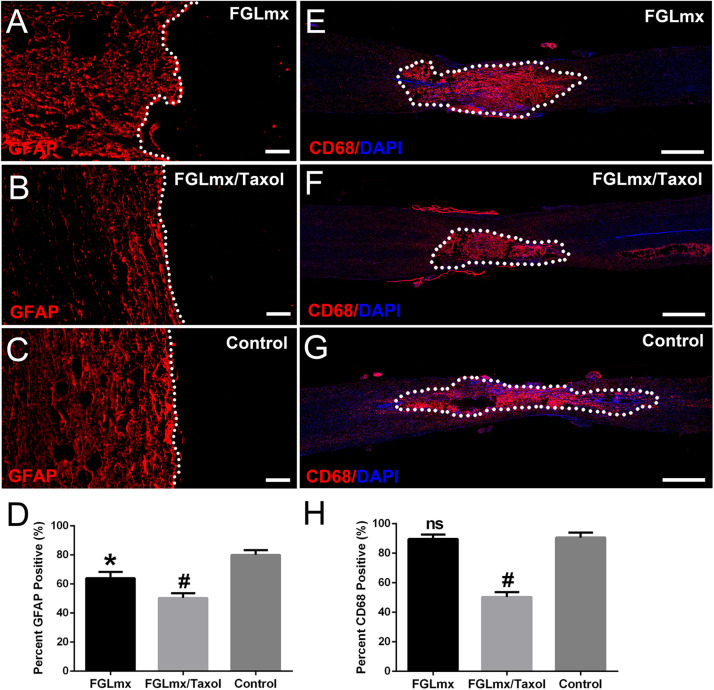
Local delivery of FGLmx/Taxol decreased glial scar formation and inflammation. Images of GFAP staining after treatment with FGLmx (A), FGLmx/Taxol (B) and 5% glucose as the control (C). The white dotted line indicates the lesion border. Representative images show longitudinal sections stained with an antibody against CD68 to visualize reactive macrophages (red) and DAPI (blue) in the FGLmx group (E), FGLmx/Taxol group (F) and control group treated with 5% glucose (G). Quantification of GFAP (D) and CD68 (H) staining (± SEM). The scale bar represents 50 μm in images A, B, and C. The scale bar represents 300 μm in images E, F, and G. #P < 0.05 compared with the other two groups; *P < 0.05 compared with the control group; ns, not significant.

