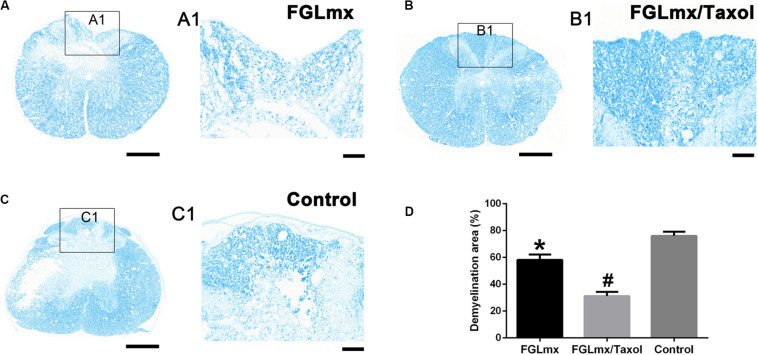
FIGURE 7.
The administration of FGLmx or FGLmx/Taxol reduced demyelination. (A–C) Histological assessment of transverse sections using LFB staining at the lesion epicenter. (A1–C1) Higher magnification micrographs of the posterior horn. The scale bar represents 100 μm. (D) Quantification of the demyelination area in the posterior horn of the lesion epicenter (± SEM). The IOD of the residual myelin sheath was higher in the FGLmx and FGLmx/Taxol groups than in the control group. The scale bar represents 500 μm in (A–C) and 100 μm in (A1,B1,C1). #P < 0.05 compared with the other two groups; *P < 0.05 compared with the control group.

