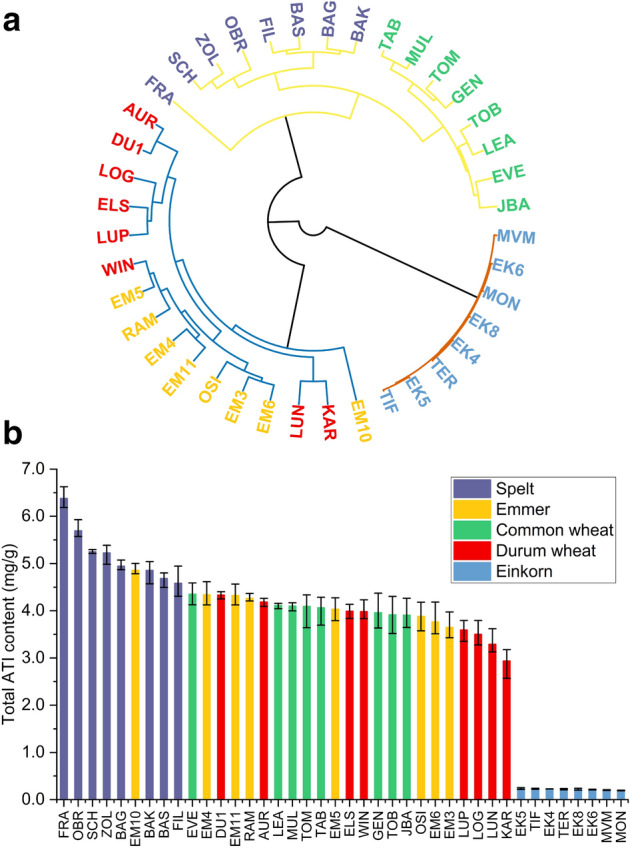
Figure 4.

(a) Hierarchical cluster analysis including the mean absolute ATI contents of the three locations. Three clusters were identified according to the ploidy level of the Triticum species: hexaploid, yellow; tetraploid, blue and diploid, red connecting lines. The single cultivars of the different wheat species are colored as in (b) and the abbreviations are shown in Supplementary Table S2. (b) Total ATI content (mg/g) per cultivar grown at the three locations, presented as mean value and error bars show the respective minimal and maximal content.
