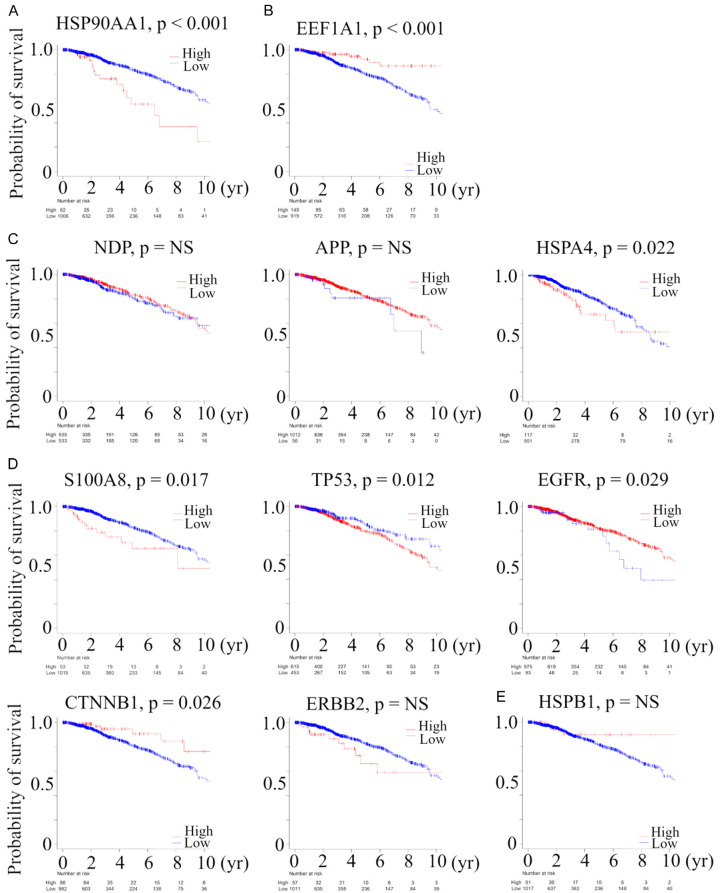
Figure 4.
Kaplan-Meier plots of the association of the presence of (A) gene common to Category 1 and 2 in baseline and delta analysis: HSP90AA1, (B) gene common to Category 1 and 2 in baseline analysis: EEF1A1, and (C) in delta analysis: NDP, APP, and HSPA4, (D) genes identified only in Category 2 in baseline: S100A8, TP53, EGFR, CTNNB1, and ERBB2 and (E) in delta analysis: HSPB1, with OS in TCGA BC cohort. The cutoff of each mRNA expression was defined as optimal cutoff to show the difference of OS. Category 1, we divided BC patients into two groups with clinical integrity, clinical concordance versus discordance. Clinical concordance was defined as a group of patients who were pCR/not relapsed and non-pCR/relapsed, according to NAC. On the other hand, clinical discordance was defined as a group of patients who were pCR/relapsed and non-pCR/not relapsed, according to NAC. Category 2, we divided NAC treated BC patients according to whether they relapsed in the group having pCR. Abbreviations: OS, overall survival; TCGA, The Cancer Genome Atlas; BC, breast cancer; NS, not significant.

