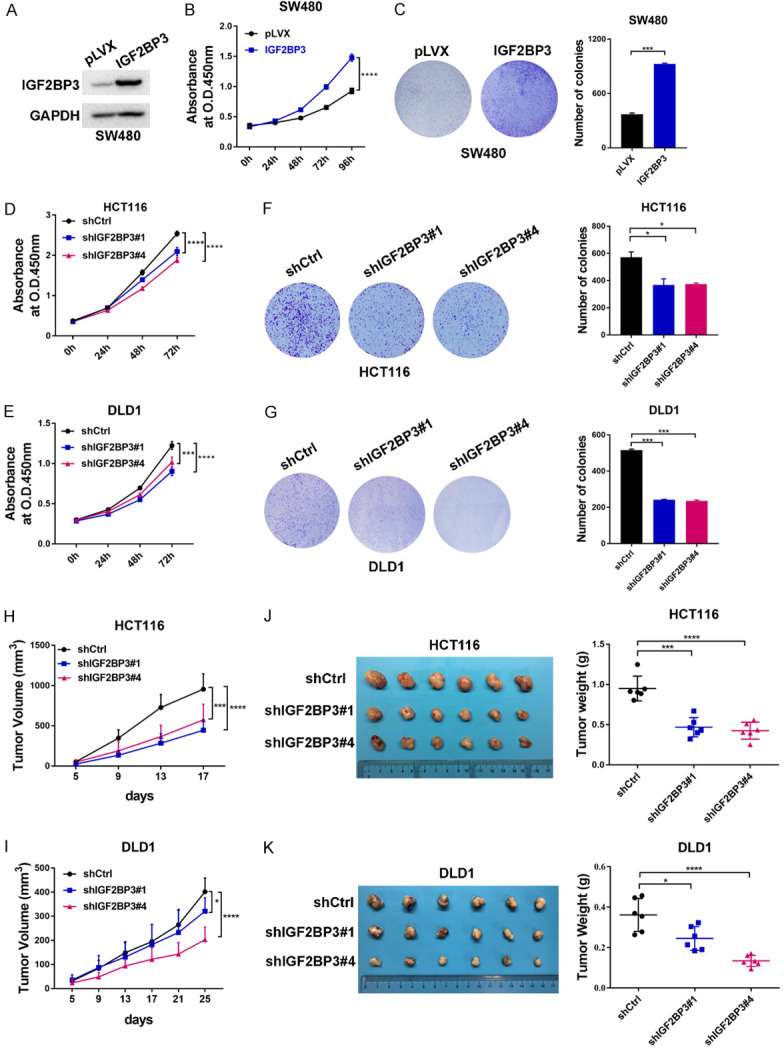
Figure 2.

Oncogenic roles of IGF2BP3 in CRC. (A) Establishment of IGF2BP3-overexpressing SW480 cells. The expression of IGF2BP3 was analyzed with western blotting analysis. (B) Cell proliferation assays were performed in the IGF2BP3-overexpressing SW480 cells and control cells. (C) A total of 10,000 IGF2BP3-overexpressing SW480 cells and control cells were seeded into 6-well plates, and the colony formation ability of each group was assessed. Representative images are shown in (C) (left panel). The results were quantitatively analyzed (right panel). (D, E) Cell proliferation assays were performed in the stable IGF2BP3-deficient HCT116 (D) and DLD1 (E) cells and control cells. (F, G) A total of 2,000 stable IGF2BP3- deficient HCT116 (F) and DLD1 (G) cells and control cells were seeded into 6-well plates, and the colony formation ability of each group was assessed. Representative images are shown in (F and G) (left panel). The results were quantitatively analyzed (right panel). (H-K) Stable IGF2BP3-depleted HCT116 (H) or DLD1 (I) cells and control cells were subcutaneously injected into male BALB/c nude mice. The tumor growth was measured (H, I). Representative images are shown (J, K left panel), and the tumor weights from each group were statistically analyzed (J, K right panel). *P<0.05, ***P<0.001, ****P<0.0001.
