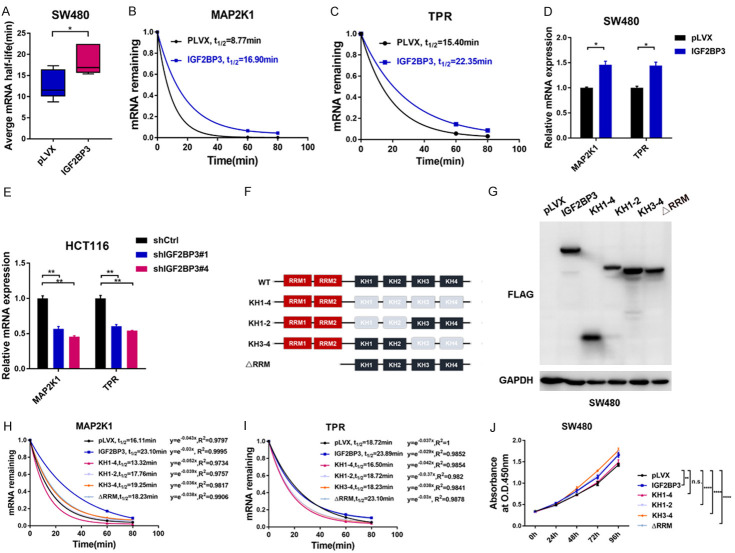
Figure 4.
Analysis of IGF2BP3-mediated mRNA stability. (A) Analysis of the average mRNA half-lives of KRAS, MAP2K1, TPR and CCNH in the SW480 cells stably overexpressing IGF2BP3 and the control cells. (B, C) Both the IGF2BP3-overexpressing SW480 cells and control cells were treated with actinomycin D for 60 and 80 min respectively. Total RNA was extracted, the relative expression of MAP2K1 (B) and TPR (C) was calculated, and the mRNA half-lives of these genes were analyzed. (D) RT-qPCR analysis was performed to analyze the mRNA expression of MAP2K1 and TPR in the SW480 cells stably overexpressing IGF2BP3 and the control cells. (E) RT-qPCR analysis was performed to analyze the mRNA expression of MAP2K1 and TPR in the IGF2BP3-deficient HCT116 cells and control cells. (F) Schematic graph depicts the RNA-binding domains of IGF2BP3 and indicated deletions mutants constructed for the following study. (G) Western blot analysis showed the molecular weights of indicated IGF2BP3 deletion mutants. (H, I) The indicated IGF2BP3 deletion mutants and IGF2BP3 (WT) were stably overexpressed in SW480 cells. Cells were treated with actinomycin D for 60 and 80 min respectively. Total RNA was extracted, the relative expression of MAP2K1 (H) and TPR (I) was calculated, and the mRNA half-lives of these genes were analyzed. (J) The indicated IGF2BP3 deletion mutants and IGF2BP3 (WT) were stably overexpressed in SW480 cells and a CCK-8 assay was performed to measure the cell proliferation in the indicated groups. *P<0.05, **P<0.01, ****P<0.0001.

