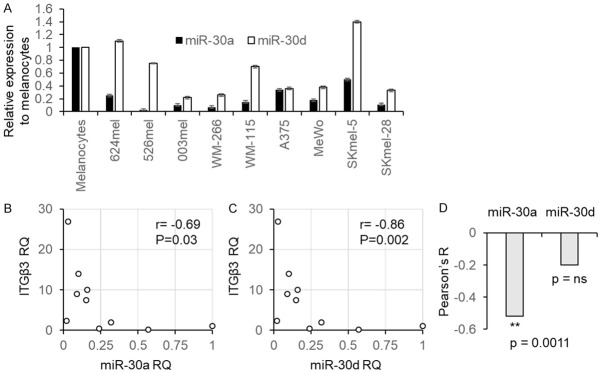
Figure 2.
miR-30a and miR-30d are inversely correlated with ITGB3. Normalized miR-30a, miR-30d and ITGB3 expression levels were determined in 10 melanoma cell lines, with the expression levels among melanocytes serving as reference level. A. Shows the expression of miR-30a and miR-30d; B. Shows the correlation of miR-30a and ITGB3; C. Shows the correlation of miR-30d and ITGB3. D. Shows the Peasron correlation R of ITGB3 with miR-30a or miR-30d in a cohort of 36 metastatic melanoma patients. Correlation was calculated using Pearson test; the mean ± SE of three experiments on independent RNA purifications, each performed in triplicates. ns denotes non-significant.

