

Abstract
The nod-like receptor protein 3 (NLRP3) is one of the most characterized inflammasomes, and its genetic variation and functional dysregulation are involved in pathogenesis of several cancers. To systematically evaluate the role of NLRP3 in predicting outcomes of patients with non-small cell lung cancer (NSCLC), we performed a two-phase analysis for associations between genetic variants in NLRP3 inflammasome pathway genes and NSCLC survival by using a published genome-wide association study (GWAS) dataset from the Prostate, Lung, Colorectal and Ovarian (PLCO) Cancer Screening Trial. We used multivariate Cox proportional hazards regression analysis with Bayesian false discovery probability (≤0.80) for multiple testing correction to evaluate associations between 20,730 single-nucleotide polymorphisms (SNPs) in 176 genes and overall survival of 1,185 NSCLC patients from the PLCO trial. We further validated the identified significant SNPs in another GWAS dataset with survival data from 984 NSCLC patients of the Harvard Lung Cancer Susceptibility (HLCS) study. The results showed that two independent SNPs in two different genes (i.e., BIRC3 rs11225211 and NRG1 rs4733124) were significantly associated with the NSCLC overall survival, with a combined hazards ratio (HR) of 0.83 [95% confidence interval (CI) = 0.74-0.93 and P = 0.0009] and 1.18 (95% CI = 1.06-1.31) and P = 0.002], respectively. However, further expression quantitative trait loci (eQTL) analysis showed no evidence for correlations between the two SNPs and mRNA expression levels of corresponding genes. These results indicated that genetic variants in the NLRP3 imflammasome pathway gene-sets might be predictors of NSCLC survival, but the molecular mechanisms underlying the observed associations warrant further investigations.
Keywords: Non-small cell lung cancer, NLRP3 inflammasome, genome-wide association study, single-nucleotide polymorphism, overall survival
Introduction
Non-small cell lung cancer (NSCLC) is the most common lung tumor, and the leading cause of cancer-related death worldwide [1]. NSCLC accounts for about 85% of lung cancer including several subtypes, such as adenocarcinoma, squamous cell carcinoma and large cell carcinoma [2]. Although advances have been made in early diagnosis and treatment of NSCLC, the prognosis of NSCLC has been still unfavorable with a dismal 5-year overall survival (OS) rate less than 20% [3], partly due to individual variability in response to available cancer therapies [4]. Therefore, it is important to better understand molecular mechanisms that contribute to individual variability in response to treatments for NSCLC.
It has been reported that inflammation plays a crucial role in carcinogenesis and tumorigenesis, such as cancer cell initiation [5] and promotion [6] as well as tumor progression [7], angiogenesis [8] and invasion [9]. Studies have revealed that the acute inflammation protects the body against infectious pathogens [10]. However, chronic inflammation, which is associated with DNA damage, tissue impairment, and genetic and epigenetic changes, may lead to cancer initiation and progression [11]. Inflammasome, an intracellular multi-protein complex, may form in response to various stimuli [12]. Yet, the exact role of inflammasome in heterogeneous tumorigenesis and thus prognosis of patients with NSCLC remains unclear.
The nod-like receptor protein 3 (NLRP3) is one component of the most characterized inflammasomes, which belongs to the NLR protein family of 22 members, and respond to a wide range of infections and endogenous ligands, such as pathogen-associated molecular patterns (PAMPs) and/or damage-associated molecular patterns (DAMPs) [13]. One study showed that dysregulated function of the NLRP3 inflammasome pathway was associated with the pathogenesis of several inflammatory diseases [14], while others showed that genetic variants in the NLRP3 inflammasome pathway genes were associated with the development of malignancies, such as chronic myeloid leukemia [15] and melanoma [16]; however, the roles of these genetic variants in initiation and promotion of cancer are still unclear, which may provide insight into therapeutic targets and prognostic significance in NSCLC.
Genome-wide association studies (GWASs) have been proven to be a powerful approach to the disease etiology by genetic analysis of complex diseases and traits [17] and have reported dozens of single-nucleotide polymorphisms (SNPs) to be associated with lung cancer risk. SNPs are characterized by a single nucleotide change in the sequences of a gene, and SNPs in the exons could change amino acid sequence and thus affect functions of the proteins. Those SNPs located in the introns, especially around the 3’ untranslated regions (3’UTR), promoter elements and splicing sites, are thought to influence gene expression levels [18]. However, it is still unknown whether SNPs in the NLRP3 inflammasome genes play any roles in cancer growth and progression. In the present study, we explored the association between genetic variants in the NLRP3 inflammasome gene-set and survival of NSCLC patients using the publically available NSCLC GWAS datasets.
Materials and methods
Study populations
As shown in the study flowchart (Figure 1), we used a two-phase study design of discovery and replication to uncover any SNPs in the NLRP3 inflammasome gene-set that possibly have an effect on survival of NSCLC patients. The discovery phase included 1,185 NSCLC patients obtained from the Prostate, Lung, Colorectal and Ovarian (PLCO) Cancer Screening Trial, after the application and access approval from National Cancer Institute (NCI). The PLCO trial is a National Cancer Institute (NCI)-funded multicenter randomized screening trial of cancer from ten medical centers in the United States between 1993 and 2011. The screening trial enrolled 77,500 men and 77,500 women aged 55-74. All individuals were randomized to either the intervention arm with screening or the control arm with standard care [19].
Figure 1.
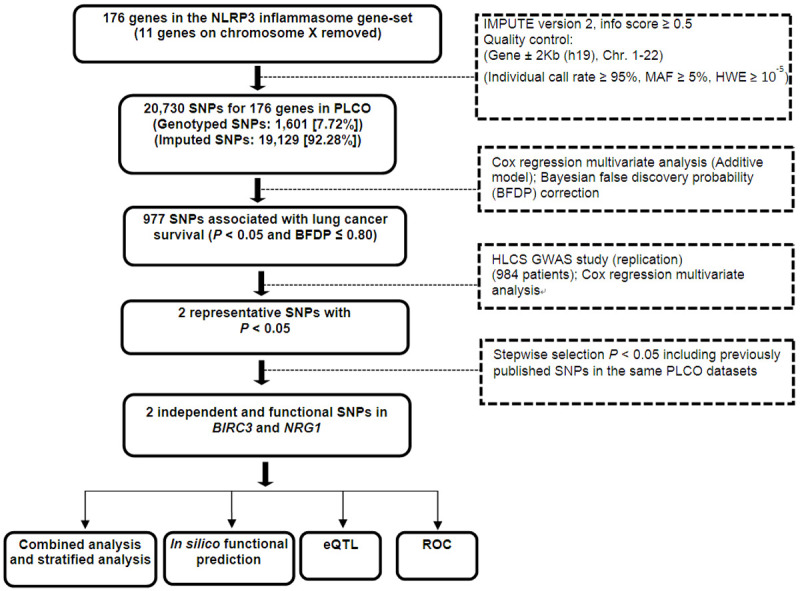
Study workflow chart. Abbreviation: SNP = single nucleotide polymorphism; PLCO = Prostate, Lung, Colorectal and Ovarian cancer trial; BFDP = Bayesian false discovery probability; eQTL = expression quantitative trait loci; ROC = receiver operating characteristic.
The PLCO trial also collected blood specimens from the first screening visit and gathered extensive information about each individual’s health status, including demographic information, smoking history and family history of cancer [20]. All participants were followed up for at least 13 years after the enrollment. Genomic DNA extracted from the blood samples was genotyped in a genome-wide scan with Illumina HumanHap240Sv1.0, Human-Hap300v1.1 and HumanHap550v3.0 (dbGaP accession: phs000093.v2.p2 and phs000336.v1.p1) [21,22]. In 1,187 Caucasian NSCLC patients from the PLCO trial, two with missing follow-up information were excluded, leading to 1,185 eligible NSCLC patients, who had the complete clinicopathological variables and genotype data for analysis. Tumor staging was determined according to the fifth edition American Joint Committee on Cancer staging system. The institutional review boards of each participating institution approved the PLCO trial and the use of biospecimen for further research, and all the subjects signed a written informed consent permitting the use of their samples and data for future research represented here.
The replication phase used another NSCLC GWAS dataset from the Harvard Lung Cancer Susceptibility (HLCS) Study with 984 histology-confirmed Caucasian NSCLC patients. The histological classification of the tumors was determined by two staff pulmonary pathologists at the Massachusetts General Hospital. The time of blood collection was within 1-4 weeks of the diagnosis for each patient. DNA was extracted from blood samples by using the Auto Pure Large Sample Nucleic Acid Purification System (QIAGEN Company, Venlo, Limburg, Netherlands). Genotyped data was obtained through genome-wise scan with Illumina Humanhap610-Quad arrays, and imputation was performed by using MaCH based on the 1000 Genomes Project. The comparison of the characteristics between the PLCO and Harvard study is presented in Table S1.
Gene and SNP selection
We selected genes involved in the NLRP3 inflammasome pathway from the Molecular Signatures Database (http://software.broadinstitute.org/gsea/msigdb/index.jsp) and Genecards (https://www.genecards.org/), by the keyword “NLRP3” and “Inflammasome”. After removing the duplicated genes and deleting genes in the X chromosome, 176 genes remained as candidate genes for further analysis (Table S2). We first performed imputation for the 176 genes with 500-kb flanking regions by using IMPUTE2 and the 1000 Genomes Project data (phase 3). After imputation, we extracted all the SNPs in these genes and within their ±2 kb flanking regions according to the following criteria: a minor allele frequency (MAF) ≥ 0.05, a genotyping rate ≥ 95%, and Hardy-Weinberg equilibrium P value ≥ 1×10⁻⁵. As a result, 1,601 genotyped SNPs and 19,129 imputed SNPs were extracted from the PLCO GWAS dataset.
Statistical analysis
The follow-up time was from the diagnosis of lung cancer to the last follow-up or time of death in both PLCO and HLCS datasets. The follow-up time was defined from lung cancer diagnosis to the last follow-up or time of death. OS was the primary endpoint, and disease-specific survival (DSS) of lung cancer was also available. In the single-locus analysis, we used multivariate Cox proportional hazards regression analysis to evaluate associations between each of 20,730 SNPs and OS/DSS (in an additive genetic model) with adjustment for age, sex, smoking status, histology, tumor stage, chemotherapy, radiotherapy, surgery and the top four principal components of the PLCO dataset using the GenABEL package of R software [23]. Since over 90% of SNPs were imputed with a high level of linkage disequilibrium (LD), we used the Bayesian false discovery probability (BFDP) with a cutoff value of 0.8 for multiple testing correction [24] after the initial evaluation with false discover rate (FDR). We assigned a prior probability of 0.10 to detect an upper bound of HR of 3.0 for an association with variant genotypes or minor alleles of the SNPs with P < 0.05. Then, we performed the replication using the HLCS GWAS dataset for those SNPs that satisfied the following conditions: 1) passed the threshold of P value < 0.05 and BFDP ≤ 0.80, 2) potentially functional predicted by HaploReg [25], SNPinfo [26] and RegulomeDB [27], and 3) tagging SNPs based on their LD. To identify independent SNPs, we included the replicated SNPs in a multivariate stepwise Cox model with adjustment for demographical and clinical variables, previous published SNPs as well as the top four principal components of the genotyping data in the PLCO dataset. A meta-analysis was also performed to combine both discovery and replication datasets. A fixed-effects model was applied, If the Cochran’s Q-test P value > 0.100 and the heterogeneity statistic (I2) < 50%; otherwise, a random-effects model was employed. Kaplan-Meier curve was used to depict associations between survival and the genotypes of the SNPs, and the combination of risk genotypes was used to estimate cumulative effects of the identified SNPs.
We further performed an expression quantitative trait loci (eQTL) analysis to assess correlations between genotypes of SNPs and mRNA expression levels by using linear regression analysis with the R (version 3.5.0) software. mRNA expression data of the genes were obtained from lymphoblastoid cell lines derived from the 373 European descendants included in the 1,000 Genomes Project [28]. We also examined the differences in mRNA expression levels between paired tumor tissues and adjacent normal tissues by the paired t test by using the data from the Cancer Genome Atlas (TCGA) database (dbGaP Study Accession: phs000178.v9.p8) [29]. Next, we assessed the association between mRNA expression and survival through Kaplan-Meier (KM) analysis in a pooled dataset (n = 1,928) (http://kmplot.com/analysis/ index.php?p=service&cancer=lung). Finally, we performed the receiver operating characteristic (ROC) curve and time-dependent ROC analysis to illustrate prediction accuracy of the models integrating both clinical and genetic variables on NSCLC survival with the “timeROC” package in R (version 3.5.0) [30]. Unless specified, all statistical analyses were performed with SAS software (version 9.4; SAS Institute, Cary, NC, USA).
Results
Associations between SNPs in the NLRP3 inflammasome gene-set and NSCLC OS in both PLCO and HLCS datasets
The study flowchart is shown in Figure 1, and basic characteristics of the 1,185 NSCLC patients have been described previously [31]. In the PLCO discovery with a single-locus analysis in an additive genetic model, the multivariate Cox regression analysis with adjustment for age, sex, smoking status, histology, tumor stage, chemotherapy, radiotherapy, surgery and first four principal components (Table S3) identified 977 SNPs that were significantly associated with NSCLC OS after multiple testing correction by BFDP ≤ 0.8 after failure in the FDR test. The results are summarized in a Manhattan plot (Figure 2A). In the replication of the top and potentially functional SNPs by the HLCS dataset, two SNPs in two different genes (i.e., BIRC3 rs11225211 and NRG1 rs4733124) were replicated as shown in Table 1, in which the multiple testing corrections by both FDR and BFDP are presented, and the association results are also shown in another Manhattan plot (Figure 2B). Further combined-analysis of these SNPs in the two datasets showed a much improved OS associated with the BIRC3 rs11225211 A allele (P adjusted = 0.0009) and a poorer OS associated with the NRG1 rs4733124 C allele (P adjusted = 0.002), without heterogeneity between the two datasets (Table 1).
Figure 2.

Manhattan plot of SNPs in the NLRP3 inflammasome pathway gene-set. The statistical values across the autosomes for associations between 27,030 SNPs and overall survival are plotted as -log10 P values. A. Manhattan plot of 27,030 SNPs in the PLCO trial, the blue horizontal line indicates P = 0.05 and the red line indicates BFDP = 0.8. B. Manhattan plot of validated SNPs in the HLCS GWAS study, the blue horizontal line indicates P = 0.05.
Table 1.
Combined analysis of the two validated SNPs in the PLCO trial and HLCS study datasets
| SNP | Allelea | Gene | FDR | BFDP | PLCO (n = 1,185) | HLCS (n = 984) | Combined analysis | |||||||
|---|---|---|---|---|---|---|---|---|---|---|---|---|---|---|
|
|
|
|
||||||||||||
| EAF | HR (95% CI)b | P b | EAF | HR (95% CI)c | P c | HR (95% CI)d | P d | Phet e | I 2 | |||||
| rs11225211 | G>A | BIRC3 | 0.33 | 0.75 | 0.17 | 0.84 (0.73-0.96) | 0.014 | 0.16 | 0.81 (0.68-0.98) | 0.029 | 0.83 (0.74-0.93) | 0.0009 | 0.780 | 0 |
| rs4733124 | T>C | NRG1 | 0.30 | 0.74 | 0.16 | 1.2 (1.05-1.38) | 0.009 | 0.18 | 1.15 (1.00-1.33) | 0.048 | 1.18 (1.06-1.31) | 0.002 | 0.714 | 0 |
Effect/reference allele;
Adjusted for age, sex, stage, histology, smoking status, chemotherapy, radiotherapy, surgery, PC1, PC2, PC3 and PC4;
Adjusted for age, sex, stage, histology, smoking status, chemotherapy, radiotherapy, surgery, PC1, PC2 and PC3;
additive model;
P value for heterogeneity by Cochrane’s Q test.
Abbreviation: PLCO = Prostate, Lung, Colorectal and Ovarian cancer trial; HLCS = Harvard Lung Cancer Susceptibility study; SNPs = Single nucleotide polymorphisms; FDR = False discovery rate; BFDP = Baysian false discovery probability; EAF = Effect allele frequency; HR = Hazards ratio; CI = Confidence interval.
Identification of independent SNPs associated with OS of NSCLC in the PLCO dataset
To identify potential functional SNPs associated with NSCLC survival, we used three bioinformatics tools (i.e., SNPinfo, RegulomeDB and HaploReg). In the RegulomeDB prediction, NRG1 rs4733124 has a score of 4, while BIRC3 rs11225211 has no data available (Table S4). Both the validated SNPs appear to be located in the intron regions with some enhancer histone marks; besides, rs4733124 is involved in two altered motifs (i.e., GZF1/Pax-4), while the rs11225211 is involved in four altered motifs based on the HaploReg prediction. However, there is no obvious evidence for functional relevance of both SNPs based on the SNPinfo prediction.
Next, the two replicated SNPs of BIRC3 rs11225211 and NRG1 rs4733124 were included in a multivariate Cox model with adjustment for demographic and clinical co-variables and other 15 previously published SNPs as well as the first four principal components available in the PLCO dataset. As a result, both SNPs remained to be independently associated with NSCLC OS (Table 2). A regional association plot was made to show the location and neighboring SNPs of each SNP (Figure S1). In the PLCO dataset, patients with the BIRC3 rs11225211 A allele had a favorable OS and DSS (P trend = 0.014 and 0.035, respectively, Table 3), while the NRG1 rs4733124 C allele had an unfavorable OS and DSS (P trend = 0.009 and 0.048, respectively, Table 3). Compared with the reference genotype in a dominant genetic model, BIRC3 rs11225211 GA+AA genotypes were associated with a favorable OS and DSS (HR = 0.80, 95% CI = 0.69-0.94 and P = 0.006 and 0.82, 0.70-0.96 and 0.016, respectively, Table 3); NRG1 rs4733124 TC+CC genotypes were associated with an unfavorable OS (1.21, 1.04-1.41 and 0.014, Table 3) but a borderline unfavorable DSS (1.14, 0.97-1.34 and 0.114, Table 3).
Table 2.
Predictors of OS obtained from the final Cox proportional hazards regression analysis in the PLCO dataset
| Variables | Category | Frequency | HR (95% CI)a | P a | HR (95% CI)b | P b |
|---|---|---|---|---|---|---|
| Age | Continuous | 1185 | 1.03 (1.02-1.05) | < 0.0001 | 1.04 (1.02-1.05) | < 0.0001 |
| Sex | Male | 698 | 1.00 | 1.00 | ||
| Female | 487 | 0.79 (0.68-0.92) | 0.002 | 0.78 (0.67-0.91) | 0.002 | |
| Smoking status | Never | 115 | 1.00 | 1.00 | ||
| Current | 423 | 1.61 (1.20-2.15) | 0.001 | 1.83 (1.35-2.46) | < 0.0001 | |
| Former | 647 | 1.59 (1.21-2.09) | 0.0009 | 1.81 (1.36-2.41) | < 0.0001 | |
| Histology | AD | 577 | 1.00 | 1.00 | ||
| SC | 285 | 1.16 (0.96-1.40) | 0.120 | 1.21 (1.00-1.47) | 0.049 | |
| Others | 323 | 1.27 (1.08-1.51) | 0.005 | 1.32 (1.10-1.57) | 0.002 | |
| Stage | I-IIIA | 655 | 1.00 | 1.00 | ||
| IIIB-IV | 528 | 2.84 (2.34-3.45) | < 0.0001 | 3.06 (2.51-3.73) | < 0.0001 | |
| Chemotherapy | No | 639 | 1.00 | 1.00 | ||
| Yes | 538 | 0.57 (0.48-0.68) | < 0.0001 | 0.57 (0.48-0.69) | < 0.0001 | |
| Radiotherapy | No | 762 | 1.00 | 1.00 | ||
| Yes | 415 | 0.96 (0.81-1.13) | 0.586 | 0.96 (0.81-1.13) | 0.620 | |
| Surgery | No | 637 | 1.00 | 1.00 | ||
| Yes | 540 | 0.21 (0.16-0.27) | < 0.0001 | 0.20 (0.15-0.26) | < 0.0001 | |
| BIRC3 rs11225211 G>A | GG/GA/AA | 814/333/37 | 0.84 (0.73-0.96) | 0.012 | 0.83 (0.72-0.96) | 0.011 |
| NRG1 rs4733124 T>C | CC/CT/TT | 841/314/29 | 1.21 (1.05-1.39) | 0.007 | 1.22 (1.06-1.40) | 0.006 |
The final analysis included age, sex, smoking status, tumor stage, tumor histology, chemotherapy, radiotherapy, surgery, top four principal components and two new validated SNPs (BIRC3 rs11225211 and NRG1 rs4733124 in an additive model);
Fifteen published SNPs were used for post-stepwise adjustment.
Five SNPs were reported in previous publication (PMID: 27557513); One SNP was reported in the previous publication (PMID: 29978465); Two SNPs were reported in the previous publication (PMID: 30259978); Two SNPs were reported in the previous publication (PMID: 26757251); Three SNPs were reported in the previous publication (PMID: 30650190); Two SNPs were reported in the previous publication (PMID: 30989732); Abbreviations: OS = Overall survival; PLCO = Prostate, Lung, Colorectal and Ovarian cancer trial; HR = Hazards ratio; CI = Confidence interval.
Table 3.
Associations of the two validated SNPs in the NLRP3 inflammasome pathway gene-set with OS of NSCLC in the PLCO dataset
| Genotype | OS Multivariate analysisa | DSS Multivariate analysisa | ||||||
|---|---|---|---|---|---|---|---|---|
|
|
|
|||||||
| All | Death (%) | HR (95% CI) | P | All | Death (%) | HR (95% CI) | P | |
| BIRC3 rs11225211 G>A | n = 1174 | n = 1174 | ||||||
| GG | 806 | 553 (68.6) | 1.00 | 806 | 496 (61.5) | 1.00 | ||
| GA | 331 | 212 (64.1) | 0.80 (0.68-0.94) | 0.005 | 331 | 191 (57.7) | 0.81 (0.68-0.96) | 0.013 |
| AA | 37 | 23 (62.2) | 0.89 (0.59-1.36) | 0.602 | 37 | 21 (56.8) | 0.94 (0.60-1.46) | 0.775 |
| Trend | 0.014 | 0.035 | ||||||
| GA+AA | 368 | 235 (63.9) | 0.80 (0.69-0.94) | 0.007 | 368 | 212 (57.6) | 0.82 (0.70-0.96) | 0.016 |
| NRG1 rs4733124 T>C | n = 1174 | n = 1174 | ||||||
| TT | 835 | 541 (64.8) | 1.00 | 835 | 493 (59.0) | 1.00 | ||
| TC | 310 | 230 (74.2) | 1.19 (1.02-1.40) | 0.029 | 310 | 198 (63.9) | 1.11 (0.94-1.31) | 0.238 |
| CC | 29 | 18 (62.1) | 1.49 (0.93-2.40) | 0.097 | 29 | 18 (62.1) | 1.68 (1.05-2.71) | 0.032 |
| Trend | 0.009 | 0.048 | ||||||
| TC+CC | 339 | 248 (73.2) | 1.21 (1.04-1.41) | 0.014 | 339 | 216 (63.7) | 1.14 (0.97-1.34) | 0.114 |
| NUGb | n = 1173 | n = 1173 | ||||||
| 0 | 264 | 159 (60.2) | 1.00 | 264 | 148 (56.1) | 1.00 | ||
| 1 | 674 | 458 (68.0) | 1.21 (1.01-1.46) | 0.040 | 674 | 409 (60.7) | 1.15 (0.95-1.40) | 0.143 |
| 2 | 235 | 171 (72.8) | 1.53 (1.22-1.90) | 0.0002 | 235 | 151 (64.3) | 1.41 (1.11-1.77) | 0.004 |
| Trend | 0.0002 | 0.004 | ||||||
| 1-2 | 909 | 629 (69.0) | 1.00 | 909 | 560 (61.6) | 1.00 | ||
| 0 | 264 | 159 (60.2) | 0.78 (0.65-0.93) | 0.006 | 264 | 148 (56.1) | 0.83 (0.68-0.99) | 0.042 |
Adjusted for age, sex, smoking status, histology, tumor stage, chemotherapy, radiotherapy, surgery, and top four principal components: with one subject with missing data for BIRC3 rs11225211 G>A genotype, one for NRG1 rs4733124 T>C genotype and 10 subjects with missing data for phenotype;
NUG = Number of unfavorable genotypes, unfavorable genotypes were BIRC3 rs11225211 GG and NRG1 rs4733124 TC+CC.
Abbreviation: SNPs = Single nucleotide polymorphisms; OS = Overall survival; NSCLC = Non-small cell lung cancer; PLCO = Prostate, Lung, Colorectal and Ovarian cancer trial; HR = Hazards ratio; CI = Confidence interval.
Combined and stratified analysis of the two independent and functional SNPs in the PLCO dataset
To provide a better estimation of individual hazards of survival, we combined the risk genotypes (i.e., rs11225211 GG and rs4733124 TC+CC) into a genetic risk score (GRS) that was used to divide all NSCLC patients into three groups: zero, one and two risk genotypes. As shown in Table 3, in the multivariate analysis, an increased genetic risk score was associated with a poorer survival [HR = 1.21 (1.01-1.46) and P = 0.040 for GRS = 1, 1.53 (1.22-1.90) and 0.0002 for GRS = 2, and P trend test = 0.0002 for OS; and 1.15 (0.95-1.40), 0.143 for GRS = 1, 1.41 (1.11-1.77) and 0.004 for GRS = 2, and 0.004 for DSS]. To dichotomize the death risk, we devided all the patients into two groups of GRS = 0 and GRS = 1-2. Compared with the group of GRS = 1-2 (the majority), the group with GRS = 0 had a better survival (HR = 0.78, 95% CI = 0.65-0.93, P = 0.006 for OS and HR = 0.83, 95% CI = 0.68-0.99, P = 0.042 for DSS). These results were further depicted in Kaplan-Meier survival curves (Figure 3A-D).
Figure 3.
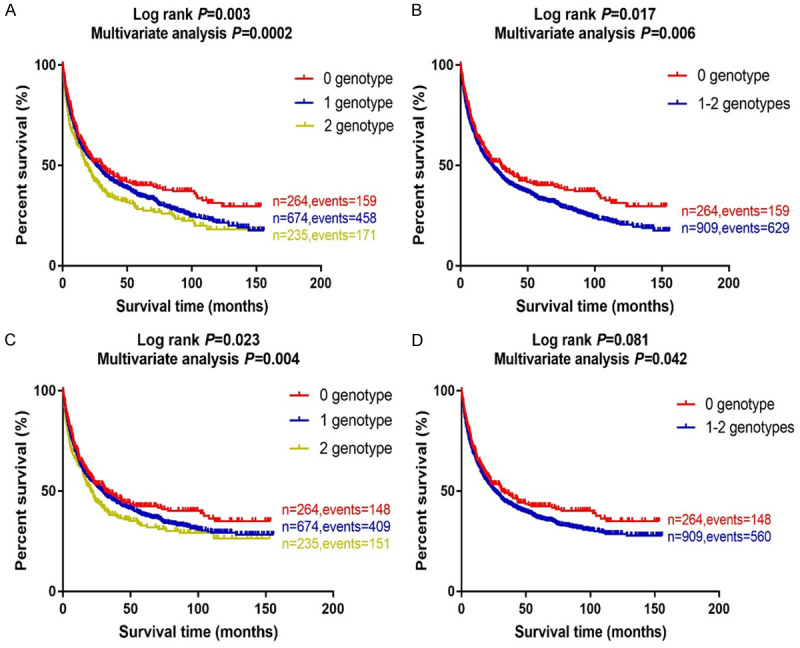
Kaplan-Meier (KM) survival curves for NSCLC patients by combined risk genotypes in the PLCO trial. (A) by 0, 1 and 2 risk genotypes and (B) by 0 and 1-2 risk genotypes for overall survival; (C) by 0, 1 and 2 risk genotypes and (D) by 0 and 1-2 risk genotypes for disease specifical survival in the PLCO trial. Abbreviations: NSCLC, non-small cell lung cancer; PLCO, Prostate, Lung, Colorectal and Ovarian cancer screening trial.
To assess the ability of risk genotypes to predict the survival of NSCLC, we compared the AUC of the model including clinical variables with that including both clinical variables and risk genotypes. The addition of risk genotypes to the prediction model of five-year OS borderline increased the AUC from 88.18% to 88.56% (P = 0.052, Figure S2A); similarly, the addition of risk genotypes to the prediction model of five-year DSS also borderline increased the AUC from 88.02% to 88.37% (P = 0.078, Figure S2B). Finally, the time-dependent AUC curve was provided to quantitate the ability of risk genotypes to predict NSCLC survival through the entire follow-up period (Figure S2C, S2D).
We further performed stratified analysis to evaluate whether the effect of combined risk genotypes on NSCLC OS and DSS was modified by age, sex, smoking status, histology, tumor stage, chemotherapy, radiotherapy and surgery. The results showed that the chemotherapy has an interaction with the 1-2 risk genotypes to have a modification effect on OS and DSS (HR = 1.01, 95% CI = 0.80-1.29 and P = 0.911 and 1.05, 0.82-1.33 and 0.719, respectively; Table S5), and the surgery also has significant interactions with the 1-2 risk genotypes to have a modification effect on OS and DSS (HR = 0.49, 95% CI = 0.34-0.72 and P = 0.0002 and 0.55, 0.36-0.83 and 0.004, respectively; Table S5).
In silico functional validation
According to experimental data from the ENCODE project (Figure S3A, S3B), no potential function of BIRC3 rs11225211 is predicted, but the NRG1 rs4733124 is predicted to be located in a DNase I hypersensitive site, which may has potential functions on chromatin rearrangement or expression regulation.
To further explore the potential function of both SNPs, we performed the eQTL analysis for the correlation between genotypes of the SNPs and mRNA expression levels in the 1000 Genomes Project and GTEx datasets. As a result, we found that the BIRC3 rs11225211A allele was not correlated with mRNA expression in the 1000 Genomes Project or GTEx datasets (Figures S4 and S5A), so was for the NRG1 rs4733124 C allele (Figure S5B). Finally, to further identify the roles of the genes in the progression of NSCLC, we assessed the mRNA expression levels of these two genes in 111 paired NSCLC tumor and adjacent normal tissue samples obtained from the TCGA database. We found that the expression levels of BIRC3 were higher in the adjacent normal tissues than in tumor tissues (P = 0.0003, Figure S6A), and the higher expression levels were associated with a poorer NSCLC OS (Figure S7A). Interestingly, the expression levels of NRG1 were also higher in the adjacent normal tissues than in tumor tissues (P < 0.001, Figure S6D), but the higher expression levels were not associated with a better NSCLC OS (Figure S7B).
Mutation analyses
Finally, to evaluate the possible role of the SNPs in regulating the gene expression in the target tissues, we accessed the mutation status of BIRC3 and NRG1 in lung tumor tissues by using the public database of the cBioPortal for Cancer Genomics. As shown in Figure S8A, S8B, BIRC3 had a low somatic mutation rate in LUSC (0.83%, 4/484) and LUAD (0.76%, 5/660) in the Pan-Lung Cancer Study [29]. In contrast, NRG1 had a relatively higher somatic mutation rate in LUAD (3.18%, 21/660) and LUSC (1.03%, 5/484) in the Pan-Lung Cancer Study [29]. As shown in the Figure S8C, BIRC3 and NRG1 have a close interaction with the frequently altered neighbor genes. Given the relatively higher mutation rate in the NRG1 gene, the mutation may play a role in the altered functions and expression in the target tissues in addition to the SNPs identified in the present study.
Discussion
In the present study, we found that two novel genetic variants (i.e., BIRC3 rs11225211 G>A and NRG1 rs4733124 T>C) in the NLRP3 inflammsome pathway gene-set were significantly associated with NSCLC survival in both PLCO trial and HLCS datasets.
Although the role of inflammasome in the development and progression of lung cancer remains unclear, a series of studies used colitis-induced colon cancer as an animal model to investigate the role of inflammasome in the development and progression of cancers. One study found that the inflammasome components could protect against colitis-associated colon cancer [32]. Other studies suggested that the cancer-related inflammation may promote tumor growth and metastasis. For example, one study reported that the NLRP3 promoted inflammation to induce skin cancer but was dispensable for the asbestos-induced mesothelioma [33]; other studies demonstrated that the activation of NLRP3 inflammasome promoted metastasis of breast cancer to liver and lung tissues [34] and that the NLRP3 inflammasome could activate the secretion of IL-18 and IL-1β, the principle components of the inflammatory response, in the lung adenocarcinoma cell line A549 [35]. These studies suggest that the NLRP3 inflammasome is involved in carcinogenesis of various organs.
BIRC3 is a family member of inhibitors of apoptosis proteins (IAPs) that may inhibit apoptosis by directly inhibiting the caspase cascade [36-38]. Several studies have reported that overexpression of BIRC3 is associated with chemo-resistance in several malignancies. For example, one study found that BIRC3-positive patients with colon cancer had a shorter disease-free survival after 5-Fu-based chemotherapy [39]. Another study found that the upregulation of BIRC3 was associated with a shorter OS in colorectal cancer [40]. Furthermore, BIRC3 could promote hepatocellular carcinoma epithelial-mesenchymal transition (EMT), cell migration, and metastasis [41]. However, in the present study, we found that the mRNA expression of BIRC3 was higher in normal lung tissues than in tumor tissues and that the higher expression of BIRC3 was associated with a poorer OS of NSCLC. Based on the mutation data from the cBioPortal for Cancer Genomics, we speculate that the mutation of BIRC3 may have some role in regulating its gene expression and thus survival, but the molecular mechanisms underlying the association between the BIRC3 rs11225211 G>A SNP and outcomes of NSCLC patients need to be further investigated.
Neuregulin 1 (NRG1) is a known ligand for the HER3 (ERBB3) receptor that, when activated by the NRG1 binding, forms a heterodimer with other HER family receptors and regulates the downstream signaling, leading to multiple biology functions, including growth, proliferation, decreased apoptosis, cellular migration and angiogenesis [42]. Oncogenic gene fusions involving NRG1 have emerged in lung adenocarcinomas and have been proposed to represent a chemo-resistant signaling axis, and such fusion genes are exclusively detected in lung adenocarcinomas of the invasive mucinous subtype in those who never smoked [43]. This subtype tumor usually presents as a multifocal and/or unresectable disease, with no effective treatment [44]. Considering many drugs that target ERBB2 (HER2) and ERBB3 (HER3), the detecting and targeting of NRG1 fusions in invasive mucinous lung adenocarcinomas may represent a therapeutic opportunity. To date, few studies have investigated the roles of genetic variants of NRG1 in the prognosis of cancers, and only one study reported that the M111T, M139I and R438H variants of NRG1 were associated with reduction of the NRG1 protein levels in patients with Hirschsprung disease [45]. In the present study, we found that the mRNA expression of NRG1 was higher in normal lung tissues than in tumor tissues in the TCGA dataset, but the expression levels did not have an effect on survival of NSCLC patients. Furthermore, the rs4733124 C allele does not seem to have an effect on the expression of NRG1 in lung cancer, either; therefore, the mechanism by which NRG1 rs4733124 T>C may affect survival of NSCLC patients needs to be further investigated.
Although we observed some associations between genetic variants in two NLRP3 inflammasome genes and NSCLS OS, supported by some functional evidence, the exact molecular mechanisms are unclear. Because the eQTL analysis did not find a correlation between the survival-associated genotypes and mRNA expression levels in the unaffected cells, further biochemical studies and functional experiments are required to corroborate the present findings. Although the sample size of PLCO was relatively large, the number of patients in subgroups was still relatively small, which might have reduced the statistical power to detect a weak effect of those SNPs under investigation in one particular subpopulation.
Acknowledgements
The authors would like to thank all the participants of the PLCO Cancer Screening Trial. The authors also thank the National Cancer Institute for providing the access to the data collected by the PLCO trial. The statements contained herein are solely those of the authors and do not represent or imply concurrence or endorsement by the National Cancer Institute. The authors would also like to acknowledge dbGaP repository for providing cancer genotyping datasets, the accession numbers for the datasets of lung cancer are phs000336.v1.p1 and phs000093.v2.p2; and the Cancer Genome Atlas (TCGA) database (dbGaP Study Accession: phs000178.v9.p8). A list of contributing investigators and funding agencies for those studies can be found in the end of Supplemental tables. Qingyi Wei was supported by the V Foundation for Cancer Research (D2017-19) and also partly supported by the Duke Cancer Institute as part of the P30 Cancer Center Support Grant (Grant ID: NIH/NCI CA014236). The Harvard Lung Cancer Susceptibility Study was supported by NIH grants 5U01CA209414, CA092824, CA074386 and CA090578 to David C. Christiani.
Disclosure of conflict of interest
None.
Abbreviations
- NSCLC
Non-small cell lung cancer
- SNPs
single nucleotide polymorphisms
- NLRP3
Nod-like receptor protein 3
- GWAS
Genome-Wide Association Study
- PLCO
the Prostate, Lung, Colorectal and Ovarian Cancer Screening Trial
- HLCS
Harvard Lung Cancer Susceptibility
- OS
overall survival
- DSS
disease special survival
- LD
linkage disequilibrium
- BFDP
Bayesian false discovery probability
- eQTL
expression quantitative trait loci
- TCGA
the Cancer Genome Atlas
- ROC
receiver operating characteristic
- HR
hazards ratio
- CI
confidence interval
- AUC
receiver operating characteristic curve
Supporting Information
References
- 1.Zaric B, Stojsic V, Tepavac A, Sarcev T, Zarogoulidis P, Darwiche K, Tsakiridis K, Karapantzos I, Kesisis G, Kougioumtzi I, Katsikogiannis N, Machairiotis N, Stylianaki A, Foroulis C, Zarogoulidis K, Perin B. Adjuvant chemotherapy and radiotherapy in the treatment of non-small cell lung cancer (NSCLC) J Thorac Dis. 2013;5(Suppl 4):S371–7. doi: 10.3978/j.issn.2072-1439.2013.05.16. [DOI] [PMC free article] [PubMed] [Google Scholar]
- 2.Yalcin AD, Kargi A, Savas B, Gorczynski RM. Interaction of allergic disease and (immune) response to cancer in patient with stage-4 adenocarcinoma of the lung. Clin Lab. 2012;58:1329–30. [PubMed] [Google Scholar]
- 3.Cui E, Deng A, Wang X, Wang B, Mao W, Feng X, Hua F. The role of adiponectin (ADIPOQ) gene polymorphisms in the susceptibility and prognosis of non-small cell lung cancer. Biochem Cell Biol. 2011;89:308–13. doi: 10.1139/o11-005. [DOI] [PubMed] [Google Scholar]
- 4.Martini N, Rusch VW, Bains MS, Kris MG, Downey RJ, Flehinger BJ, Ginsberg R. Factors influencing ten-year survival in resected stages I to IIIa non-small cell lung cancer. J Thorac Cardiovasc Surg. 1999;117:32–6. doi: 10.1016/s0022-5223(99)70467-8. [DOI] [PubMed] [Google Scholar]
- 5.Le Magnen C, Virk RK, Dutta A, Kim JY, Panja S, Lopez-Bujanda ZA, Califano A, Drake C, Mitrofanova A, Abate-Shen C. Cooperation of loss of NKX3.1 and inflammation in prostate cancer initiation. Dis Model Mech. 2018;11:dmm035139. doi: 10.1242/dmm.035139. [DOI] [PMC free article] [PubMed] [Google Scholar]
- 6.Engels EA. Inflammation in the development of lung cancer: epidemiological evidence. Expert Rev Anticancer Ther. 2008;8:605–15. doi: 10.1586/14737140.8.4.605. [DOI] [PubMed] [Google Scholar]
- 7.Bremnes RM, Al-Shibli K, Donnem T, Sirera R, Al-Saad S, Andersen S, Stenvold H, Camps C, Busund LT. The role of tumor-infiltrating immune cells and chronic inflammation at the tumor site on cancer development, progression, and prognosis: emphasis on non-small cell lung cancer. J Thorac Oncol. 2011;6:824–33. doi: 10.1097/JTO.0b013e3182037b76. [DOI] [PubMed] [Google Scholar]
- 8.De la Garza MM, Cumpian AM, Daliri S, Castro-Pando S, Umer M, Gong L, Khosravi N, Caetano M, Ramos-Castañeda M, Flores A, Beltran E, Tran H, Tuvim M, Ostrin E, Dickey B, Evans C, Moghaddam S. COPD-Type lung inflammation promotes K-ras mutant lung cancer through epithelial HIF-1alpha mediated tumor angiogenesis and proliferation. Oncotarget. 2018;68:32972–83. doi: 10.18632/oncotarget.26030. [DOI] [PMC free article] [PubMed] [Google Scholar]
- 9.Zhang L, Chen C, Duanmu J, Wu Y, Tao J, Yang A, Yin X, Xiong B, Gu J, Li C, Liu Z. Cryptotanshinone inhibits the growth and invasion of colon cancer by suppressing inflammation and tumor angiogenesis through modulating MMP/TIMP system, PI3K/Akt/mTOR signaling and HIF-1alpha nuclear translocation. Int Immunopharmacol. 2018;65:429–437. doi: 10.1016/j.intimp.2018.10.035. [DOI] [PubMed] [Google Scholar]
- 10.Perdomo OJ, Cavaillon JM, Huerre M, Ohayon H, Gounon P, Sansonetti PJ. Acute inflammation causes epithelial invasion and mucosal destruction in experimental shigellosis. J Exp Med. 1994;180:1307–19. doi: 10.1084/jem.180.4.1307. [DOI] [PMC free article] [PubMed] [Google Scholar]
- 11.Cavanagh MM, Weyand CM, Goronzy JJ. Chronic inflammation and aging: DNA damage tips the balance. Curr Opin Immunol. 2012;24:488–93. doi: 10.1016/j.coi.2012.04.003. [DOI] [PMC free article] [PubMed] [Google Scholar]
- 12.Masumoto J. [“The inflammasomes”] . Nihon Rinsho Meneki Gakkai Kaishi. 2011;34:346–54. doi: 10.2177/jsci.34.346. [DOI] [PubMed] [Google Scholar]
- 13.Song Z, Lin Z, He F, Jiang L, Qin W, Tian Y, Wang R, Huang S. NLRP3 is expressed in human dental pulp cells and tissues. J Endod. 2012;38:1592–7. doi: 10.1016/j.joen.2012.09.023. [DOI] [PubMed] [Google Scholar]
- 14.Song N, Li T. Regulation of NLRP3 inflammasome by phosphorylation. Front Immunol. 2018;9:2305. doi: 10.3389/fimmu.2018.02305. [DOI] [PMC free article] [PubMed] [Google Scholar]
- 15.Zhang A, Yu J, Yan S, Zhao X, Chen C, Zhou Y, Zhao X, Hua M, Wang R, Zhang C, Zhong C, He N, Ji C, Ma D. The genetic polymorphism and expression profiles of NLRP3 inflammasome in patients with chronic myeloid leukemia. Hum Immunol. 2018;1:57–62. doi: 10.1016/j.humimm.2017.10.013. [DOI] [PubMed] [Google Scholar]
- 16.Zhao X, Hua M, Yan S, Yu J, Han F, Zhong C, Wang R, Zhang C, Hou M, Ma D. The genetic polymorphisms of NLRP3 inflammasome associated with T helper cells in patients with multiple myeloma. J Immunol Res. 2018;2018:7569809. doi: 10.1155/2018/7569809. [DOI] [PMC free article] [PubMed] [Google Scholar]
- 17.International Multiple Sclerosis Genetics Consortium (IMSGC) Comprehensive follow-up of the first genome-wide association study of multiple sclerosis identifies KIF21B and TMEM39A as susceptibility loci. Hum Mol Genet. 2010;19:953–62. doi: 10.1093/hmg/ddp542. [DOI] [PMC free article] [PubMed] [Google Scholar]
- 18.Savas S, Tuzmen S, Ozcelik H. Human SNPs resulting in premature stop codons and protein truncation. Hum Genomics. 2006;5:274–86. doi: 10.1186/1479-7364-2-5-274. [DOI] [PMC free article] [PubMed] [Google Scholar]
- 19.Weissfeld JL, Schoen RE, Pinsky PF, Bresalier RS, Doria-Rose VP, Laiyemo AO, Church T, Yokochi L, Yurgalevitch S, Rathmell J, Andriole G, Buys S, Crawford E, Fouad M, Isaacs C, Lamerato L, Reding D, Prorok P, Berg C PLCO Project Team. Flexible sigmoidoscopy in the randomized prostate, lung, colorectal, and ovarian (PLCO) cancer screening trial: added yield from a second screening examination. J Natl Cancer Inst. 2012;104:280–9. doi: 10.1093/jnci/djr549. [DOI] [PMC free article] [PubMed] [Google Scholar]
- 20.Oken MM, Marcus PM, Hu P, Beck TM, Hocking W, Kvale PA, Cordes J, Riley T, Winslow S, Peace S, Levin D, Prorok P, Gohagan J PLCO Project Team. Baseline chest radiograph for lung cancer detection in the randomized Prostate, Lung, Colorectal and Ovarian Cancer Screening Trial. J Natl Cancer Inst. 2005;97:1832–9. doi: 10.1093/jnci/dji430. [DOI] [PubMed] [Google Scholar]
- 21.Tryka KA, Hao L, Sturcke A, Jin Y, Wang ZY, Ziyabari L, Lee M, Popova N, Sharopova N, Kimura M, Feolo M. NCBI’s database of genotypes and phenotypes: dbGaP. Nucleic Acids Res. 2014;42:D975–9. doi: 10.1093/nar/gkt1211. [DOI] [PMC free article] [PubMed] [Google Scholar]
- 22.Mailman MD, Feolo M, Jin Y, Kimura M, Tryka K, Bagoutdinov R, Hao L, Kiang A, Paschall J, Phan L, Popova N, Pretel S, Ziyabari L, Lee M, Shao Y, Wang Z, Sirotkin K, Ward M, Kholodov M, Zbicz K, Beck J, Kimelman M, Shevelev S, Preuss D, Yaschenko E, Graeff A, Ostell J, Sherry S. The NCBI dbGaP database of genotypes and phenotypes. Nat Genet. 2007;39:1181–6. doi: 10.1038/ng1007-1181. [DOI] [PMC free article] [PubMed] [Google Scholar]
- 23.Aulchenko YS, Ripke S, Isaacs A, van Duijn CM. GenABEL: an R library for genome-wide association analysis. Bioinformatics. 2007;10:1294–6. doi: 10.1093/bioinformatics/btm108. [DOI] [PubMed] [Google Scholar]
- 24.Wakefield J. A Bayesian measure of the probability of false discovery in genetic epidemiology studies. Am J Hum Genet. 2007;81:208–27. doi: 10.1086/519024. [DOI] [PMC free article] [PubMed] [Google Scholar]
- 25.Ward LD, Kellis M. HaploReg: a resource for exploring chromatin states, conservation, and regulatory motif alterations within sets of genetically linked variants. Nucleic Acids Res. 2012;40:D930–4. doi: 10.1093/nar/gkr917. [DOI] [PMC free article] [PubMed] [Google Scholar]
- 26.Xu Z, Taylor JA. SNPinfo: integrating GWAS and candidate gene information into functional SNP selection for genetic association studies. Nucleic Acids Res. 2009;37:W600–5. doi: 10.1093/nar/gkp290. [DOI] [PMC free article] [PubMed] [Google Scholar]
- 27.Boyle AP, Hong EL, Hariharan M, Cheng Y, Schaub MA, Kasowski M, Karczewski K, Park J, Hitz B, Weng S, Cherry J, Snyder M. Annotation of functional variation in personal genomes using RegulomeDB. Genome Res. 2012;9:1790–7. doi: 10.1101/gr.137323.112. [DOI] [PMC free article] [PubMed] [Google Scholar]
- 28.Lappalainen T, Sammeth M, Friedlander MR, t Hoen PA, Monlong J, Rivas MA, Gonzàlez-Porta M, Kurbatova N, Griebel T, Ferreira P, Barann M, Wieland T, Greger L, van Iterson M, Almlöf J, Ribeca P, Pulyakhina I, Esser D, Giger T, Tikhonov A, Sultan M, Bertier G, MacArthur D, Lek M, Lizano E, Buermans H, Padioleau I, Schwarzmayr T, Karlberg O, Ongen H, Kilpinen H, Beltran S, Gut M, Kahlem K, Amstislavskiy V, Stegle O, Pirinen M, Montgomery S, Donnelly P, McCarthy M, Flicek P, Strom T, Consortium G, Lehrach H, Schreiber S, Sudbrak R, Carracedo A, Antonarakis S, Häsler R, Syvänen A, van Ommen G, Brazma A, Meitinger T, Rosenstiel P, Guigó R, Gut I, Estivill X, Dermitzakis E. Transcriptome and genome sequencing uncovers functional variation in humans. Nature. 2013;7468:506–11. doi: 10.1038/nature12531. [DOI] [PMC free article] [PubMed] [Google Scholar]
- 29.Cancer Genome Atlas Research Network. Comprehensive molecular profiling of lung adenocarcinoma. Nature. 2014;7511:543–50. doi: 10.1038/nature13385. [DOI] [PMC free article] [PubMed] [Google Scholar]
- 30.Chambless LE, Diao G. Estimation of time-dependent area under the ROC curve for long-term risk prediction. Stat Med. 2006;25:3474–86. doi: 10.1002/sim.2299. [DOI] [PubMed] [Google Scholar]
- 31.Wang Y, Liu H, Ready NE, Su L, Wei Y, Christiani DC, Wei Q. Genetic variants in ABCG1 are associated with survival of nonsmall-cell lung cancer patients. Int J Cancer. 2016;138:2592–601. doi: 10.1002/ijc.29991. [DOI] [PMC free article] [PubMed] [Google Scholar]
- 32.Chapkin RS, Kamen BA, Callaway ES, Davidson LA, George NI, Wang N, Lupton J, Finnell R. Use of a novel genetic mouse model to investigate the role of folate in colitis-associated colon cancer. J Nutr Biochem. 2009;20:649–55. doi: 10.1016/j.jnutbio.2008.07.001. [DOI] [PMC free article] [PubMed] [Google Scholar]
- 33.Chow MT, Tschopp J, Moller A, Smyth MJ. NLRP3 promotes inflammation-induced skin cancer but is dispensable for asbestos-induced mesothelioma. Immunol Cell Biol. 2012;90:983–6. doi: 10.1038/icb.2012.46. [DOI] [PubMed] [Google Scholar]
- 34.Hu Q, Zhao F, Guo F, Wang C, Fu Z. Polymeric nanoparticles induce NLRP3 inflammasome activation and promote breast cancer metastasis. Macromol Biosci. 2017;17 doi: 10.1002/mabi.201700273. [DOI] [PubMed] [Google Scholar]
- 35.Schmidt RL, Lenz LL. Distinct licensing of IL-18 and IL-1beta secretion in response to NLRP3 inflammasome activation. PLoS One. 2012;9:e45186. doi: 10.1371/journal.pone.0045186. [DOI] [PMC free article] [PubMed] [Google Scholar]
- 36.Miura K, Fujibuchi W, Ishida K, Naitoh T, Ogawa H, Ando T, Yazaki N, Watanabe K, Haneda S, Shibata C, Sasaki I. Inhibitor of apoptosis protein family as diagnostic markers and therapeutic targets of colorectal cancer. Surg Today. 2011;41:175–82. doi: 10.1007/s00595-010-4390-1. [DOI] [PubMed] [Google Scholar]
- 37.Deveraux QL, Reed JC. IAP family proteins-suppressors of apoptosis. Genes Dev. 1999;13:239–52. doi: 10.1101/gad.13.3.239. [DOI] [PubMed] [Google Scholar]
- 38.Altieri DC. Survivin and IAP proteins in cell-death mechanisms. Biochem J. 2010;430:199–205. doi: 10.1042/BJ20100814. [DOI] [PMC free article] [PubMed] [Google Scholar]
- 39.Hideaki K, Koh M, Wataru F, Kazuyuki I, Naoyuki K, Makoto K, Okabe M, Ando T, Murata Y, Sasaki H, Takami K, Yamamura A, Shibata C, Sasaki I. Down-regulation of cIAP2 enhances 5-FU sensitivity through the apoptotic pathway in human colon cancer cells. Cancer Sci. 2010;5:903–13. doi: 10.1111/j.1349-7006.2009.01112.x. [DOI] [PMC free article] [PubMed] [Google Scholar]
- 40.Maryla K, Hoguen K, Chul K, Haeyoun K, Kate W, Shu-Ichi M, Tsukamoto M, Thomas R, Assa-Munt N, Piao Z, Suzuki K, Perucho M, Krajewski S, Reed J. Analysis of apoptosis protein expression in early-stage colorectal cancer suggests opportunities for new prognostic biomarkers. Clin Cancer Res. 2005;11:5451–61. doi: 10.1158/1078-0432.CCR-05-0094. [DOI] [PubMed] [Google Scholar]
- 41.Fu PY, Hu B, Ma XL, Yang ZF, Yu MC, Sun HX, Huang A, Zhang X, Wang J, Hu Z, Zhou C, Tang W, Ning R, Xu Y, Zhou J. New insight into BIRC3: a novel prognostic indicator and a potential therapeutic target for liver cancer. J Cell Biochem. 2019;120:6035–6045. doi: 10.1002/jcb.27890. [DOI] [PubMed] [Google Scholar]
- 42.Jeong H, Kim J, Lee Y, Seo JH, Hong SR, Kim A. Neuregulin-1 induces cancer stem cell characteristics in breast cancer cell lines. Oncol Rep. 2014;32:1218–24. doi: 10.3892/or.2014.3330. [DOI] [PubMed] [Google Scholar]
- 43.Duruisseaux M, Wislez M. CD74-NRG1: a new fusion gene in lung adenocarcinomas characterizing mucinous adenocarcinomas. Bull Cancer. 2014;101:529–30. [PubMed] [Google Scholar]
- 44.Jones MR, Lim H, Shen Y, Pleasance E, Ch’ng C, Reisle C, Leelakumari S, Zhao C, Yip S, Ho J, Zhong E, Ng T, Ionescu D, Schaeffer D, Mungall A, Mungall K, Zhao Y, Moore R, Ma Y, Chia S, Ho C, Renouf D, Gelmon K, Jones S, Marra M, Laskin J. Successful targeting of the NRG1 pathway indicates novel treatment strategy for metastatic cancer. Ann Oncol. 2017;28:3092–3097. doi: 10.1093/annonc/mdx523. [DOI] [PubMed] [Google Scholar]
- 45.Luzon-Toro B, Torroglosa A, Nunez-Torres R, Enguix-Riego MV, Fernandez RM, de Agustin JC, Antiñolo G, Borrego S. Comprehensive analysis of NRG1 common and rare variants in Hirschsprung patients. PLoS One. 2012;5:e36524. doi: 10.1371/journal.pone.0036524. [DOI] [PMC free article] [PubMed] [Google Scholar]
Associated Data
This section collects any data citations, data availability statements, or supplementary materials included in this article.