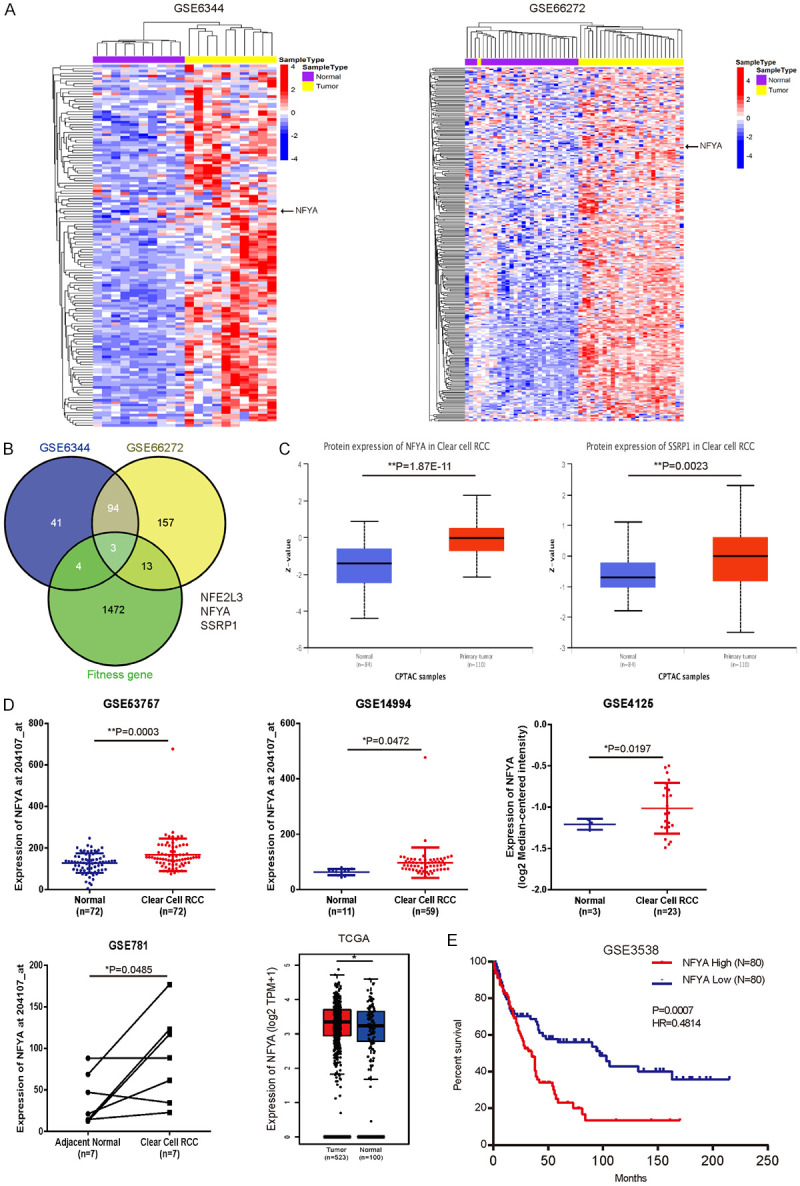
Figure 1.

Upregulation of NFYA in ccRCC patients. A. Heatmap of upregulated transcription factors (fold change > 1.5) in ccRCC versus paired-matched adjacent normal tissues (GSE6344 and GSE66272). B. Veen plot of the overlapping genes based on GSE6344 (142 upregulated transcription factors), GSE66272 (267 upregulated transcription factors) and RCC fitness genes. RCC fitness gene was defined as appeared at least 2 out of 3 RCC cell lines in Behan’s study [47]. C. The protein level of NFYA and SSRP1 in primary ccRCC and normal tissues was analyzed from UALCAN [38]. D. mRNA expression of NFYA between ccRCC and normal kidney tissues was analyzed from GSE53757, GSE14994 and GSE4125 cohort. Results were presented as the mean ± standard deviation (SD). TCGA analysis of NFYA expression between kidney renal clear cell carcinoma (KIRC) and normal kidney tissues (including TCGA and GTEx data) was derived from GEPIA [37]. E. Overall survival rates between NFYA-low and NFYA-high groups of the 160 ccRCC patients from GSE3538 were compared. Median NFYA expression was used as the cutoff in survival analysis (log-rank test). *P < 0.05, **P < 0.01.
